Revenue_Metrics_Dashboard
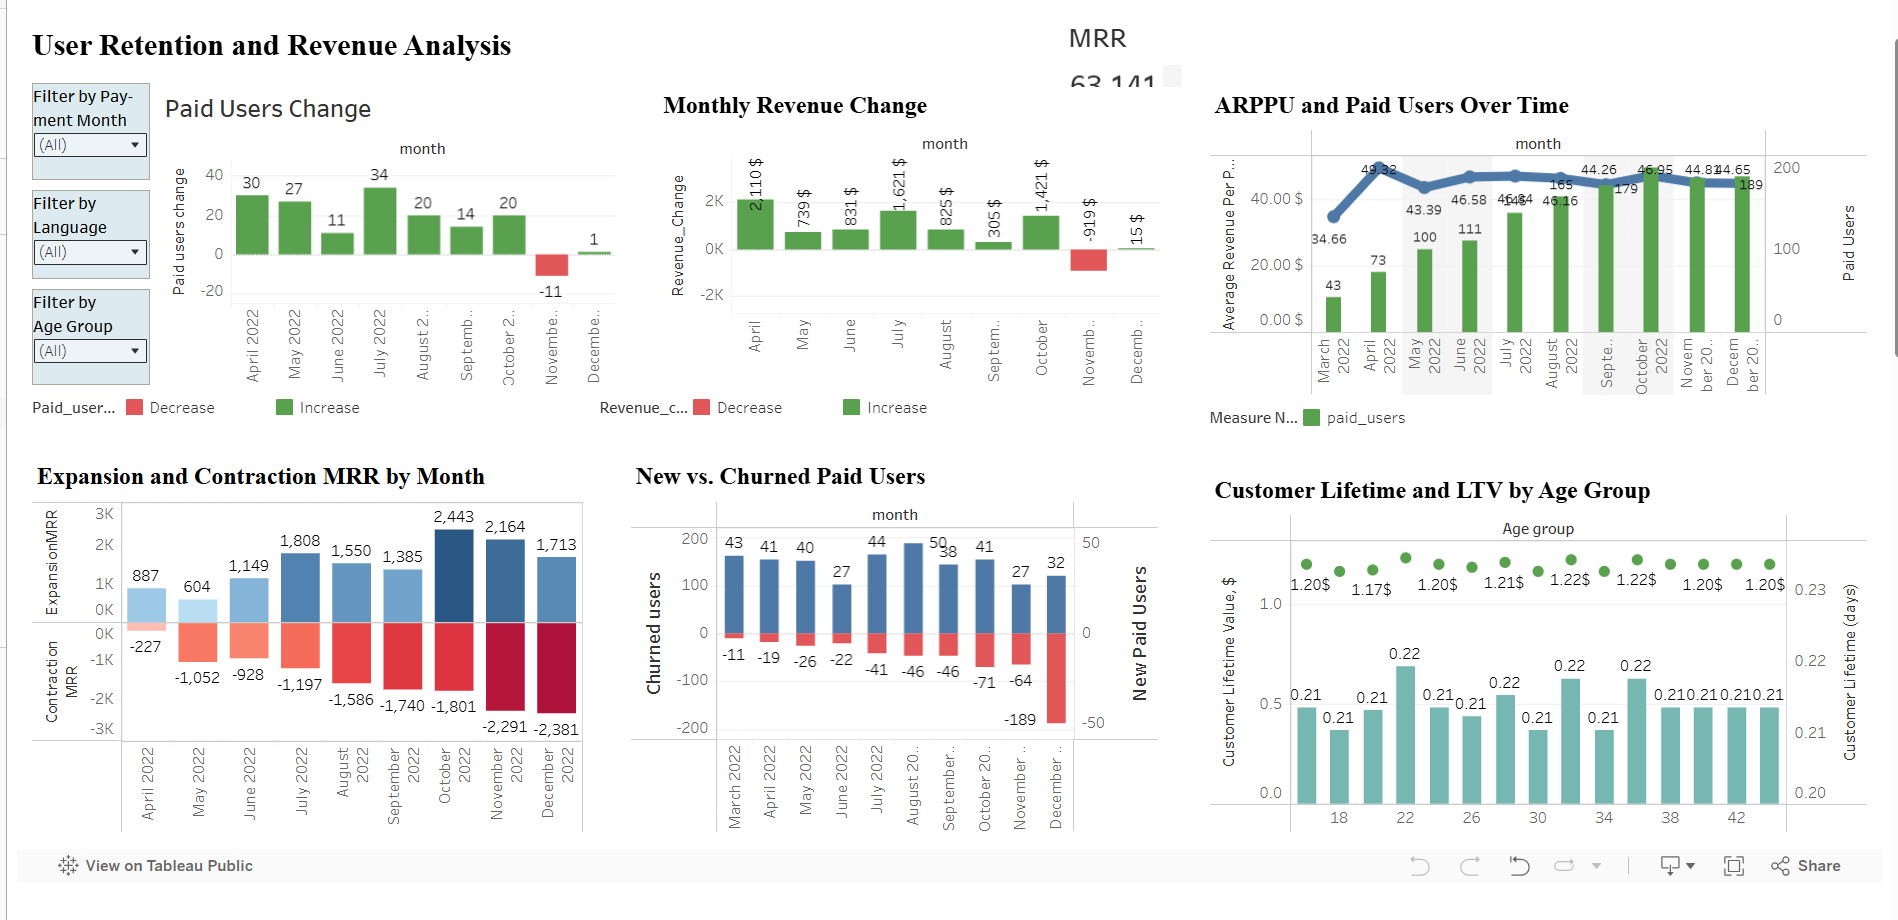
The main idea is to create a dashboard that allows you to track key monetization metrics in real time, helping the business team quickly assess monetary performance and user behavior in the game. This tool helps you identify why revenue is falling, which users are leaving the game, and where there is potential for growth.
The main functionality is:
• display of key metrics (MRR, ARPPU, Churn Rate, LTV)
• revenue dynamics graphs
• filters by date, language, game, and age
• analysis of new/lost users, expansion/reduction of MRR
For implementation, I used SQL in BigQuery and Tableau Public for visualization.
The main idea is to create a dashboard that allows you to track key monetization metrics in real time, helping the business team quickly assess monetary performance and user behavior in the game. This tool helps you identify why revenue is falling, which users are leaving the game, and where there is potential for growth. The main functionality is: • display of key metrics (MRR, ARPPU, Churn Rate, LTV) • revenue dynamics graphs • filters by date, language, game, and age • analysis of new/lost users, expansion/reduction of MRR For implementation, I used SQL in BigQuery and Tableau Public for visualization.
Навички: Analytical Skills · Creative Problem Solving · SQL · Tableau · Data Analysis · Intellectual · Soft Skills
 Подольск