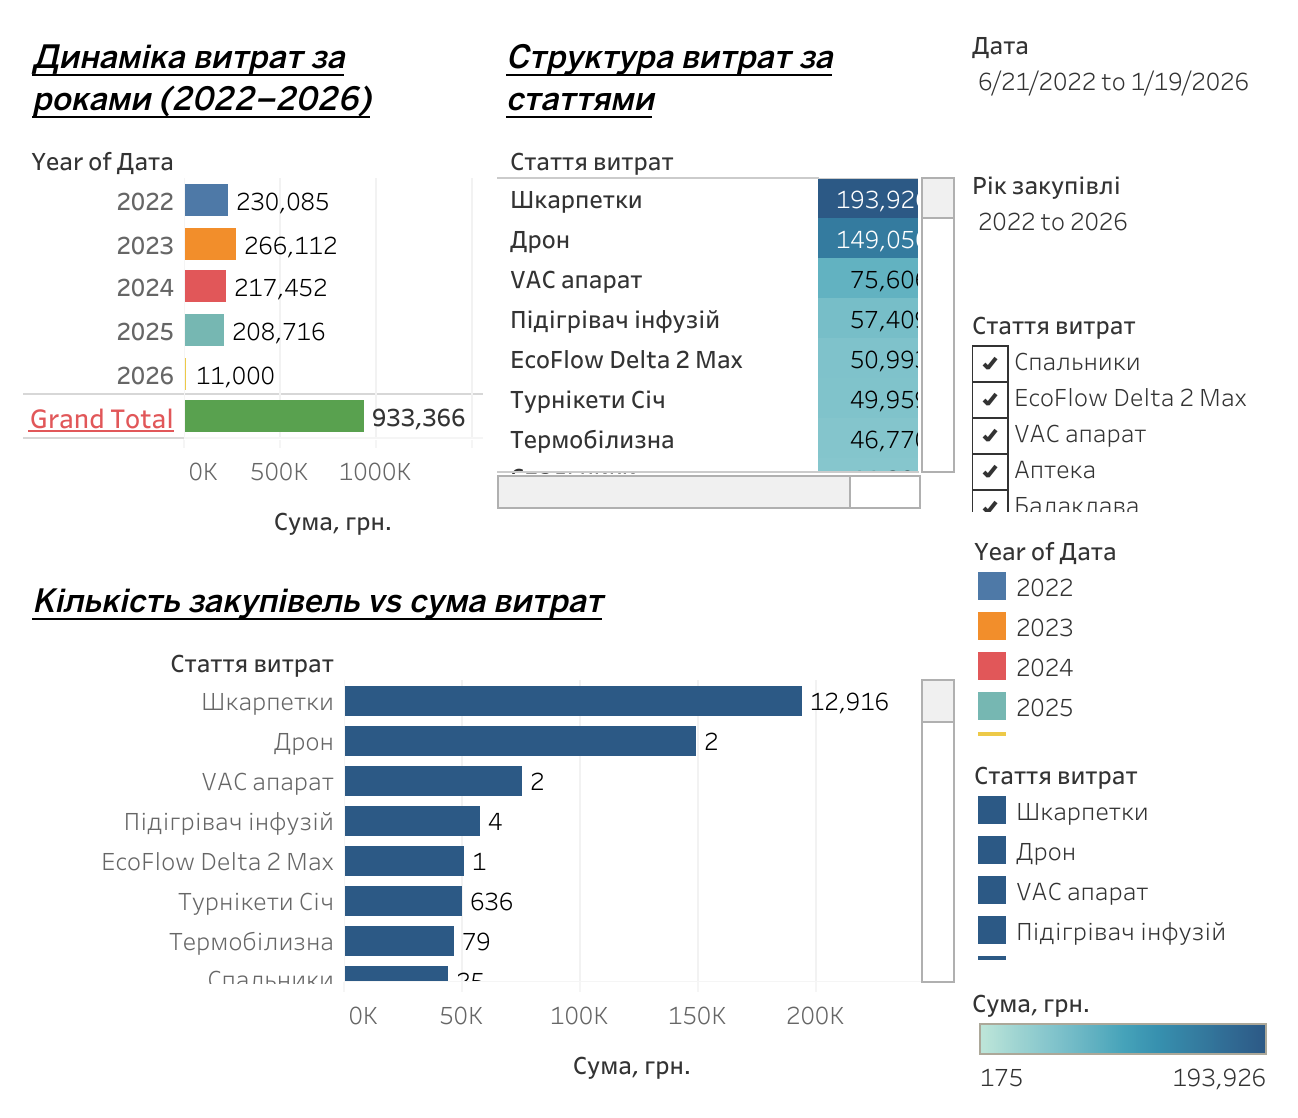
This project is an interactive Tableau dashboard based on real expense data related to aid provided to the Armed Forces of Ukraine from 2022 to 2026.
The dashboard includes key financial KPIs such as total expenses, number of purchases, average purchase amount, and the largest single purchase. It also visualizes spending dynamics over time and expense distribution by categories.
Users can filter data by year, date range, and expense category, enabling transparent analysis and data-driven decision-making.
Tools: Tableau, calculated fields, KPI dashboards, filters, time-series analysis, data aggregation.