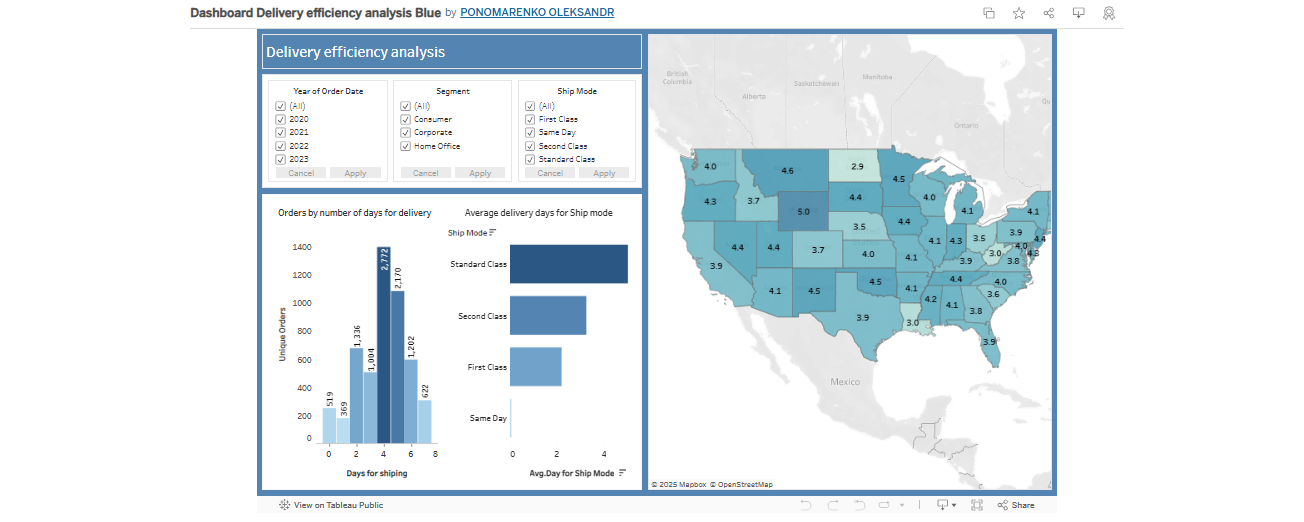
Time series of sales and profits were created with a breakdown by month, and profitability by category and subcategories was examined in terms of delivery methods. Delivery times were separately analyzed: the average number of days in different US states, the distribution of orders by delivery duration, and the differences between delivery types. All results were visualized on interactive sheets and collected in a dashboard with the ability to filter by order date, segment, and delivery method.