Analysis of the institution's admission campaign
Data Processing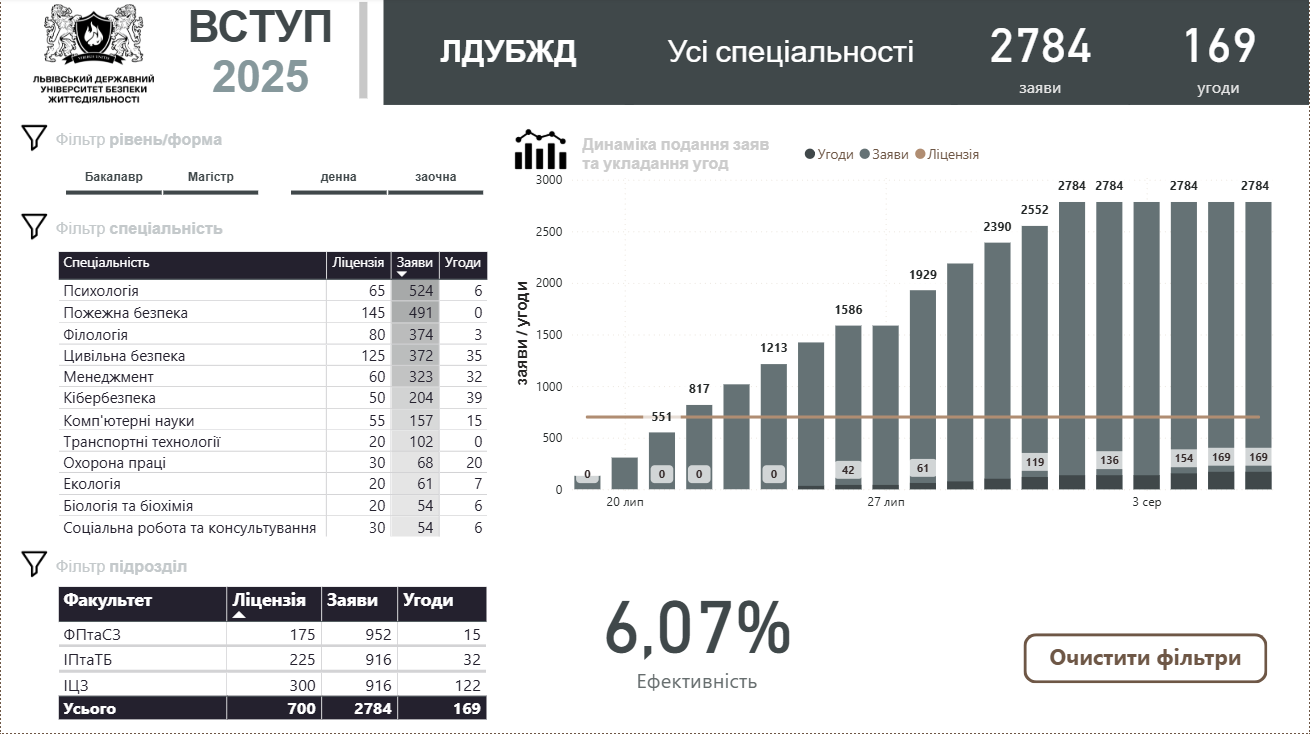
Format: Power BI + Google Sheets
Description:
A comprehensive system for collecting, processing, and visualizing data about the admission campaign. The project covers all stages — from data entry by operators to an analytical dashboard for management.
Components:
Google Sheets — Operator Interface:
Validation of input
Simplification of the data collection process
Pivot table (Google Sheets):
Automatic data aggregation
Formulas and pivot tables for analytics
Power BI dashboard:
Interactive visualization (filters, charts, summaries)
Monitoring applications, deals, efficiency
Ability to filter by specialty, form, faculty, etc.
Result:
The system allows real-time tracking of the admission campaign, analyzing effectiveness, and making managerial decisions based on current data.