Automation of Financial Reporting Presentations
Accounting Services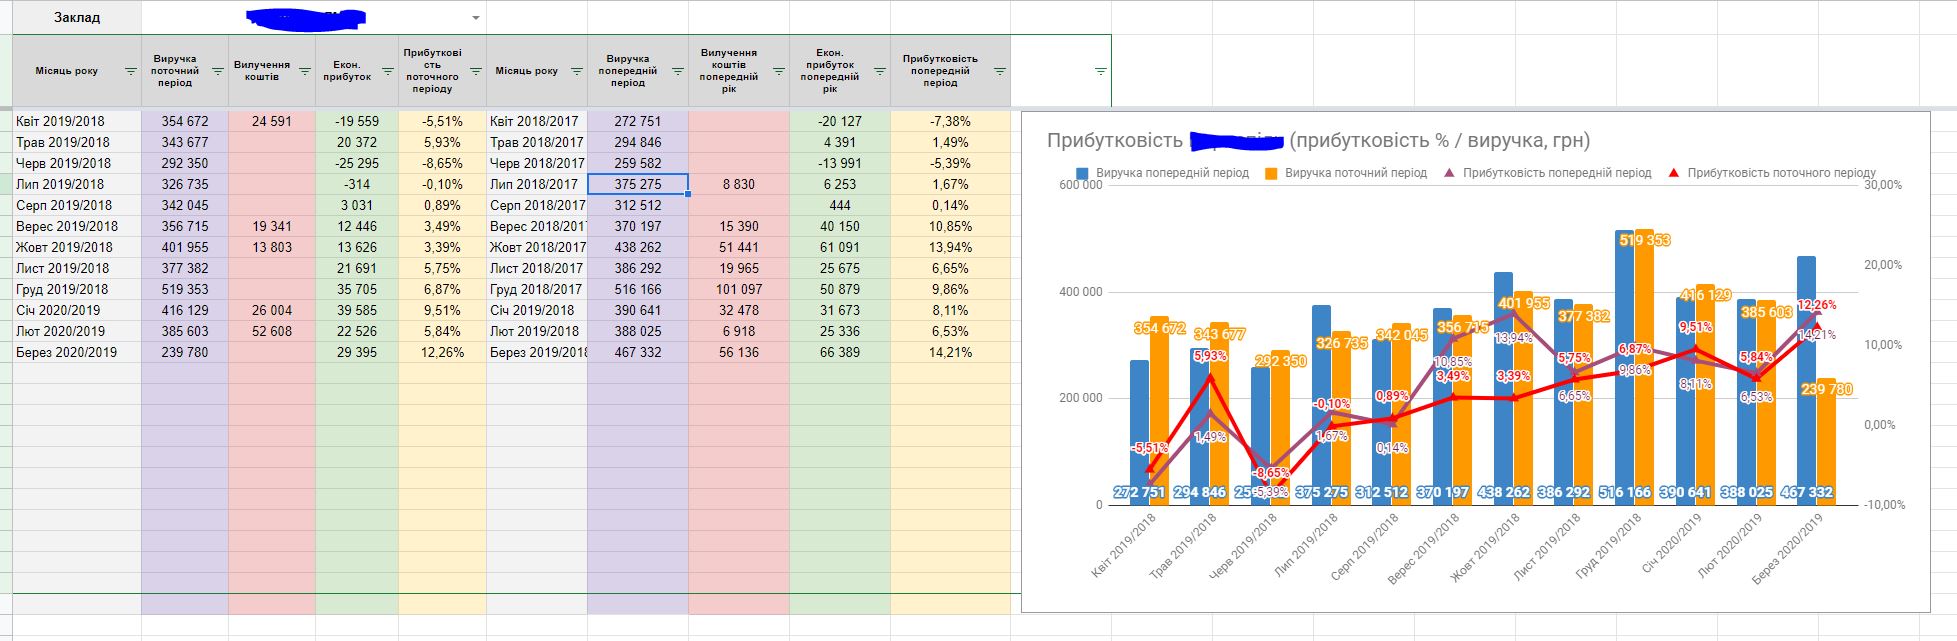
The task is to create an automated presentation of the financial indicators of the activities of restaurants on the basis of the Google Drive tools. The princes of work are:
- The corresponding reports are downloaded from the SRM or accounting programs (expenses income, balance sheet, goods remains, etc.);
- downloaded into a file (in a formed database);
- select the analysis period in the file (the number of months);
- Choose the period of forecast required (the number of months)
- then automatic update of all indicators, tables, graphs, presentations occurs
Visualization of results in any form (year-to-year comparisons, dynamics, selective comparisons, data grouping, indicators analysis, the creation of control points, user access, data protection.
Advantages compared to Excel - placement in online services; ability to set access (on the level of pages, comrades); ability to work simultaneously with several users; notification of making changes to the file; viewing the entire history of changes, etc.