Developed the desktop application BioSpectra Analyzer for visualization and basic analysis of spectral data of bioorganic compounds.
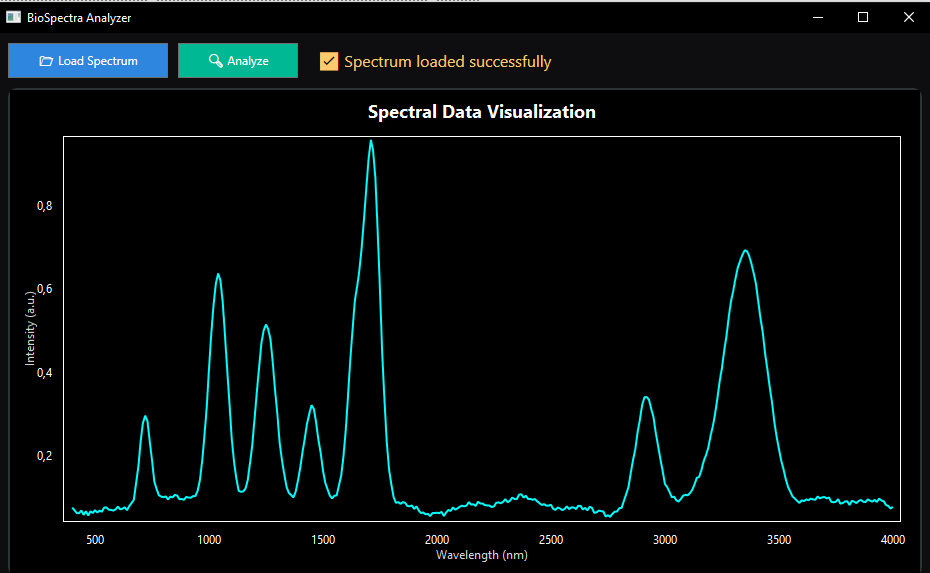
The program allows loading spectral data from TXT/CSV files, constructing an interactive spectrum graph, finding local intensity peaks, and comparing them with simple templates of functional groups. This is a demonstration scientific and applied tool for processing experimental data and preliminary assessment of the possible class of the compound.
Key features:
- loading spectral data from TXT/CSV;
- processing two-column data: wavelength / intensity;
- constructing a spectrum graph in a WPF interface;
- finding local maxima;
- highlighting found peaks on the graph;
- comparing peaks with templates of functional groups;
- determining the most likely class of the compound;
- dark interface for convenient data visualization.
Built-in analysis templates:
- Alcohol;
- Ketone;
- Amine;
- Carboxylic Acid;
- Ester;
- Alkene.
Technologies:
C#, WPF, XAML, .NET Framework 4.8.1, OxyPlot, processing CSV/TXT data.
The project is a prototype of a scientific desktop tool and can be expanded: add report export, improved peak finding algorithm, a database of reference spectra, import of Excel files, and more accurate matching of compounds.
#CSharp #WPF #DotNet #OxyPlot #DesktopApp #DataVisualization #SpectralAnalysis #CSV #ScientificSoftware