This project is a web application developed on the basis of Dash and Flask, which allows users to display interactive charts for financial data analysis. The main goal of the project is to provide a convenient tool for working with market data, including candlestick analysis, asset correlation, and data collection from the OKX exchange.
Key features
1. Dynamic candlestick chart
The user can select a currency pair and timeframe.
Data is loaded from the database and displayed as a candlestick chart.
Automatic chart updates are supported when parameters change.
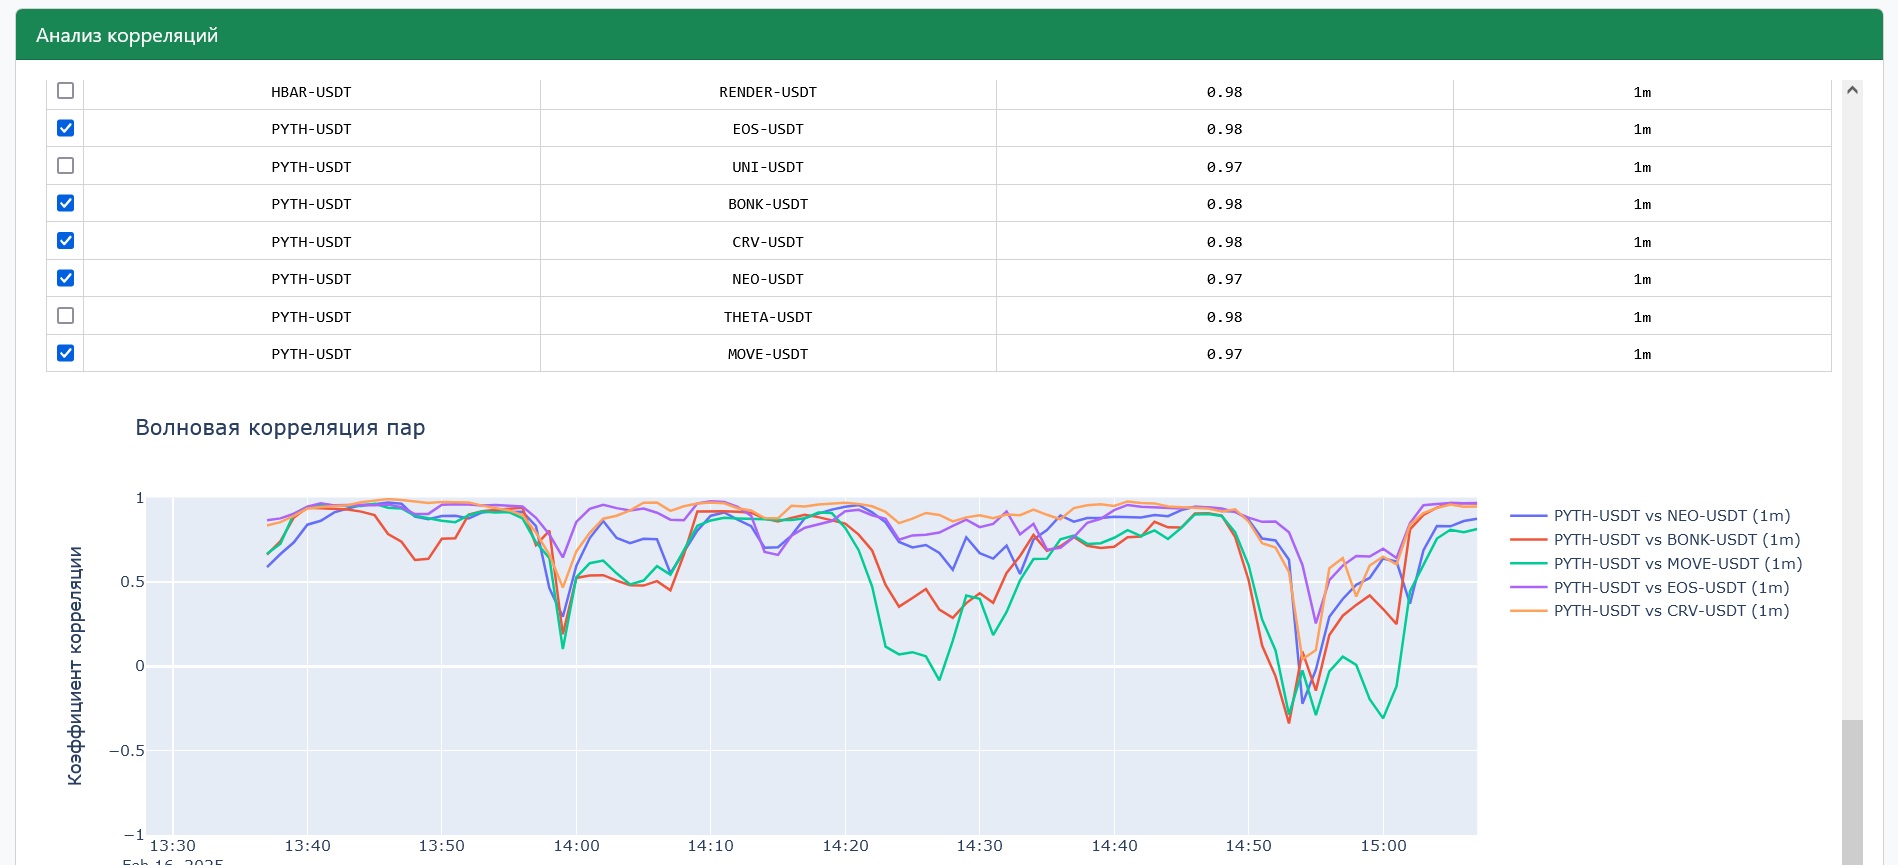
2. Asset correlation chart
The correlation coefficient between currency pairs is calculated.
A table of pairs with a coefficient above a specified level is displayed.
The ability to mark pairs with checkboxes and build their chart.
Automatic assignment of different colors for visual differentiation of pairs on the chart.
3. Registration and authorization (Flask)
A user system is implemented through Flask.
Access to chart pages is only available for authorized users.
A JWT token is used for session security.
4. Working with the OKX exchange API
a) Parser for collecting new candles
Works in real-time, collecting data for 75 currency pairs with a capitalization of over 1 billion.
Automatically updates the database with new candles.
b) Parser for historical data
Allows loading data for a specified period.
The possibility of adding other exchanges in the future is supported.
Technologies and tools
Django – backend framework and database management.
Dash/Plotly – interactive charts.
Flask – user authentication (registration, login, access control).
Pandas – data processing.
SQLite/PostgreSQL – data storage.
OKX API – source of market data.
Key features
1. Dynamic candlestick chart
The user can select a currency pair and timeframe.
Data is loaded from the database and displayed as a candlestick chart.
Automatic chart updates are supported when parameters change.
2. Asset correlation chart
The correlation coefficient between currency pairs is calculated.
A table of pairs with a coefficient above a specified level is displayed.
The ability to mark pairs with checkboxes and build their chart.
Automatic assignment of different colors for visual differentiation of pairs on the chart.
3. Registration and authorization (Flask)
A user system is implemented through Flask.
Access to chart pages is only available for authorized users.
A JWT token is used for session security.
4. Working with the OKX exchange API
a) Parser for collecting new candles
Works in real-time, collecting data for 75 currency pairs with a capitalization of over 1 billion.
Automatically updates the database with new candles.
b) Parser for historical data
Allows loading data for a specified period.
The possibility of adding other exchanges in the future is supported.
Technologies and tools
Django – backend framework and database management.
Dash/Plotly – interactive charts.
Flask – user authentication (registration, login, access control).
Pandas – data processing.
SQLite/PostgreSQL – data storage.
OKX API – source of market data.