Case 1: Transforming the customer experience for the company.
Data Processing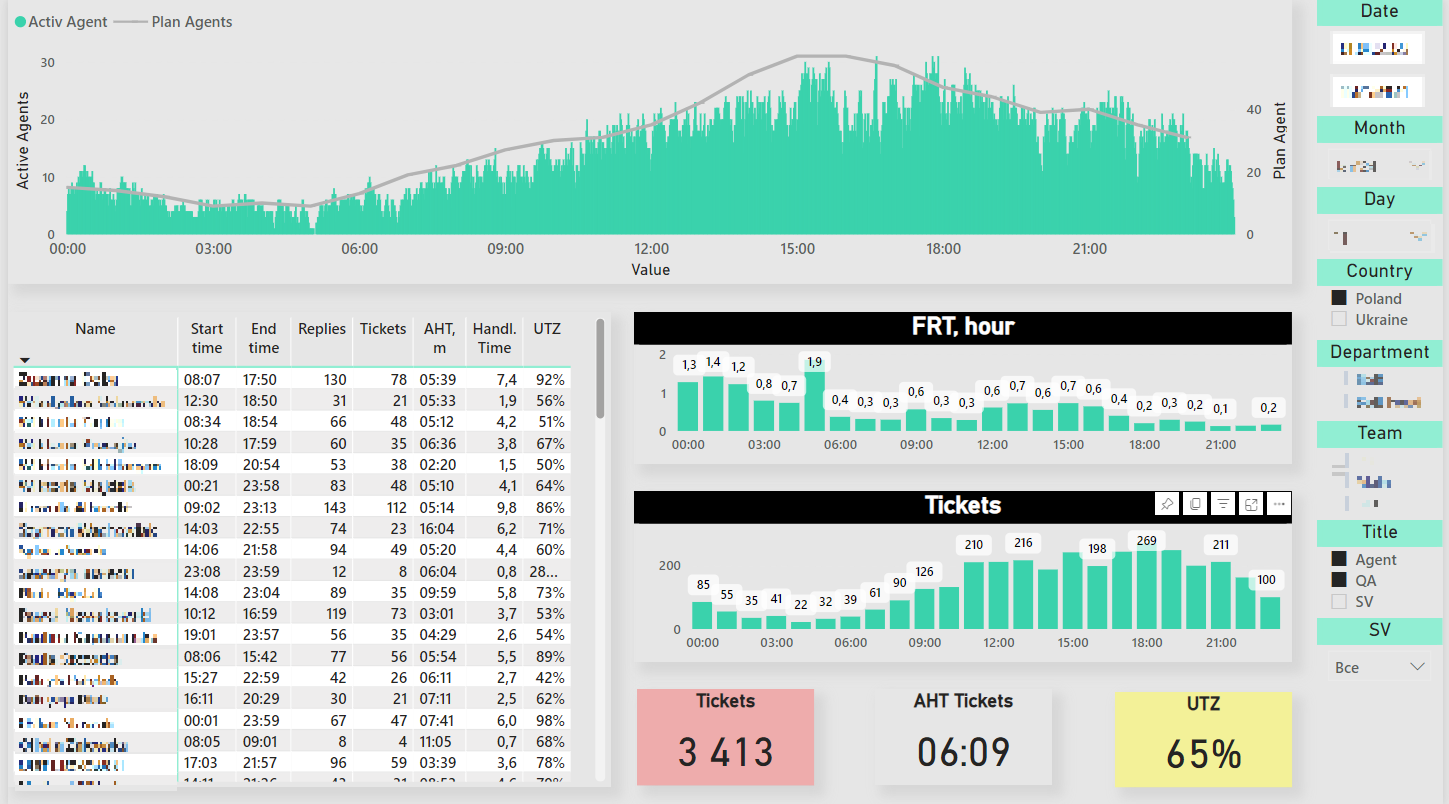
The Prejudice:
The delivery service company has addressed us in order to optimize customer experience and improve the efficiency of customer support operations.
The Decision:
We have introduced Power BI for comprehensive analysis and visualization of data related to customer satisfaction indicators and key performance indicators of customer support agents.
The Results:
1 . Customer satisfaction: Increase customer satisfaction by 25% thanks to personalized insights and data-based improvements.
The 2nd Efficiency of agents: Key KPIs for support services agents were monitored, which resulted in a 30% increase in overall operating efficiency.
The visualization:
Our Power BI visualization has converted complex delivery data into attractive and intuitively understandable dashboards. Real-time monitoring panels provide up-to-date information about the efficiency of service, the level of customer satisfaction and key indicators of the efficiency of agents.
The delivery service company has addressed us in order to optimize customer experience and improve the efficiency of customer support operations.
The Decision:
We have introduced Power BI for comprehensive analysis and visualization of data related to customer satisfaction indicators and key performance indicators of customer support agents.
The Results:
1 . Customer satisfaction: Increase customer satisfaction by 25% thanks to personalized insights and data-based improvements.
The 2nd Efficiency of agents: Key KPIs for support services agents were monitored, which resulted in a 30% increase in overall operating efficiency.
The visualization:
Our Power BI visualization has converted complex delivery data into attractive and intuitively understandable dashboards. Real-time monitoring panels provide up-to-date information about the efficiency of service, the level of customer satisfaction and key indicators of the efficiency of agents.