Description:
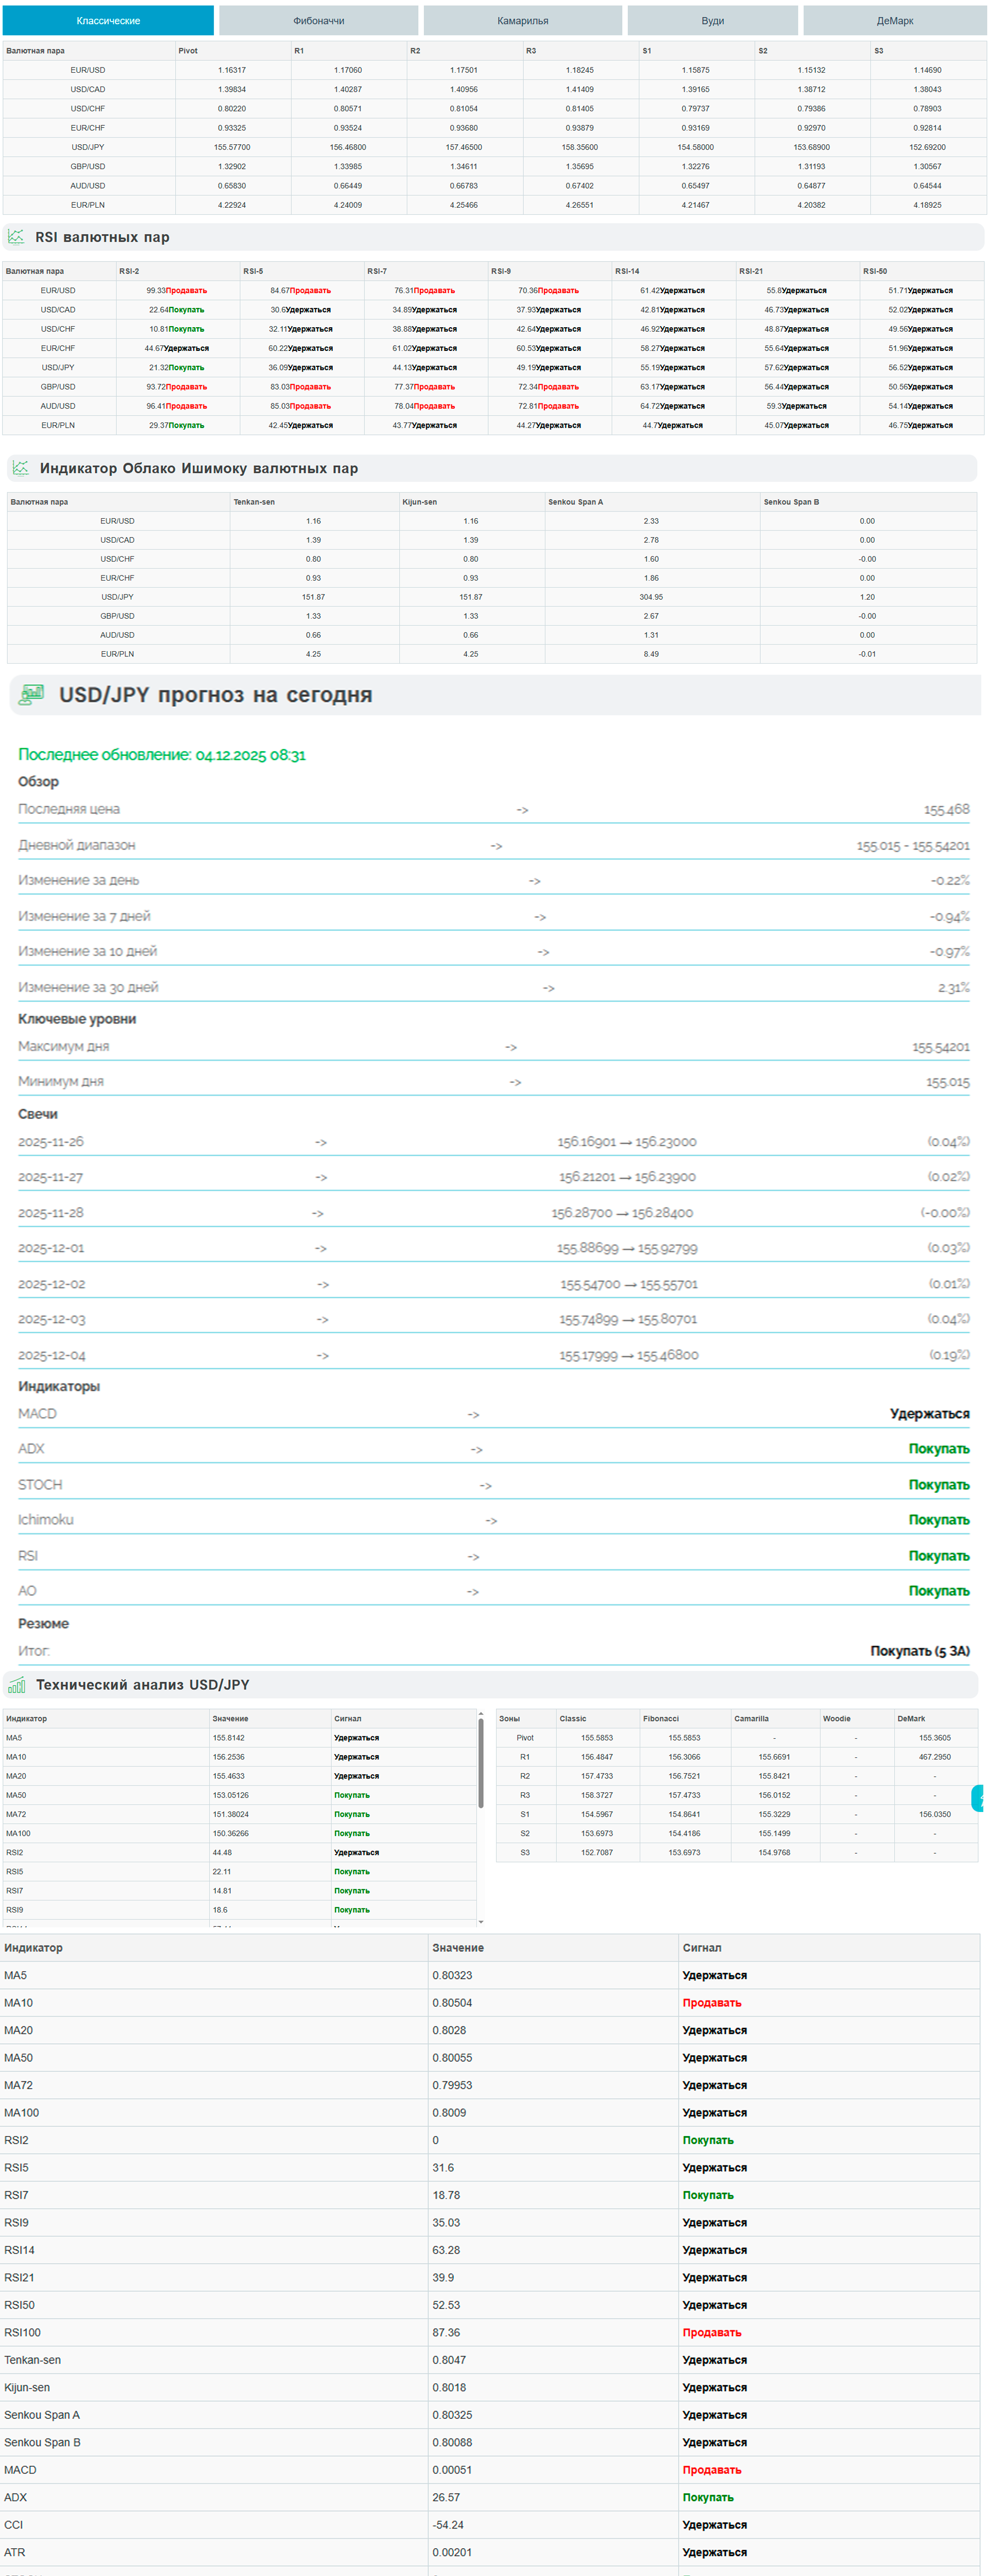
Developed a set of web widgets for stock market analysis that display key technical indicators (MA, Ichimoku, Pivot Points, RSI, ADX, ATR, Stochastic) based on data from the Yahoo Finance API for a project on #WordPress.
Data updates are implemented every 15 minutes, the widgets are easy to embed on the website, and allow the user to quickly visualize the state of the market or individual stocks.
Technology Stack
Backend / server component: #PHP (proxy script function-proxy-yahoo-finance.php) — receives and processes data from the Yahoo Finance API.
Frontend: #JavaScript — logic for updating widgets, rendering indicators.
Styling: #CSS — styling of the widgets.
Architecture: a combination of #server-side (data processing / aggregation) + client-side (visualization, updating).
Data update: configured for a frequency of ~15 minutes — which allows for relatively fresh data without excessive load.
Capabilities and Features
Support for multiple technical indicators:
Moving Averages (MA)
Ichimoku Indicator
Pivot Points
Relative Strength Indicator (RSI)
ADX (Average Directional Index)
ATR (Average True Range)
STOCH (Stochastic)
Data source: Yahoo Finance #API — allows obtaining quotes and other market data.
Background updates: every ~15 minutes – ensures the relevance of information when used on the website.
The widget easily integrates into a web page / dashboard — can be used to display the state of stocks, the market, or individual instruments.
User interface: displays charts / indicators, allows for visual assessment of parameters and trends.
Goal: to provide a "quick overview" of technical analysis without the need to deploy full-fledged analytical software.