This dataset provides a detailed view of global cyber security threats and incidents. It includes various attributes such as attack sources, types, countries involved, financial impact, and defense mechanisms. The data has been enhanced with additional features to support advanced analytical and machine learning tasks.
1-File Name: cyber_security_threats.csv
2-Source: Kaggle
3-Rows: (3000)
4-Columns: 13
##Tools Used: 1-Python (Pandas, Matplotlib, Seaborn), Power BI
##Status: Cleaned, analyzed, and visualized
##Features
Feature Description
1-attack_source Origin or initiator of the attack (e.g., botnet, malware, insider). 2-attack_type Type of cyberattack (e.g., DDoS, phishing, ransomware). 3-country Country where the attack was initiated or reported. 4-defence_mechanism Method used to mitigate or respond to the attack. 5-financial_loss Estimated monetary loss due to the attack (USD). 6-incident_resolution_time Time taken to resolve the incident (in hours or days). 7-number_of_affected_user Number of users impacted by the attack. 8-security_vulnerability_type Vulnerability exploited (e.g., SQL injection, zero-day, misconfiguration). 9-target_industry Industry affected (e.g., finance, healthcare, education). 10-year Year of occurrence. 11-threats_level (Added) Custom-calculated level of threat (e.g., Low, Medium, High). 12-attacks_per_country (Added) Aggregated number of attacks per country.
##Use Cases
1-Exploratory Data Analysis (EDA)
2-Trend analysis of cybersecurity threats over the years
3-Predictive modeling of financial loss or resolution time
4-Clustering based on threat levels or regions
5-Visualization dashboards (Power BI, Tableau, etc.)
6-Cybersecurity risk analysis
7-Data storytelling dashboards
8-Machine learning experiments (e.g., predicting financial loss)
9-Corporate threat profiling
##The dataset was cleaned and processed using Python, including:
1-Handling missing values
2-Feature engineering (threats_level, attacks_per_country)
3-Data type conversions
4-Exploratory Data Analysis using Matplotlib & Seaborn
##Visualization
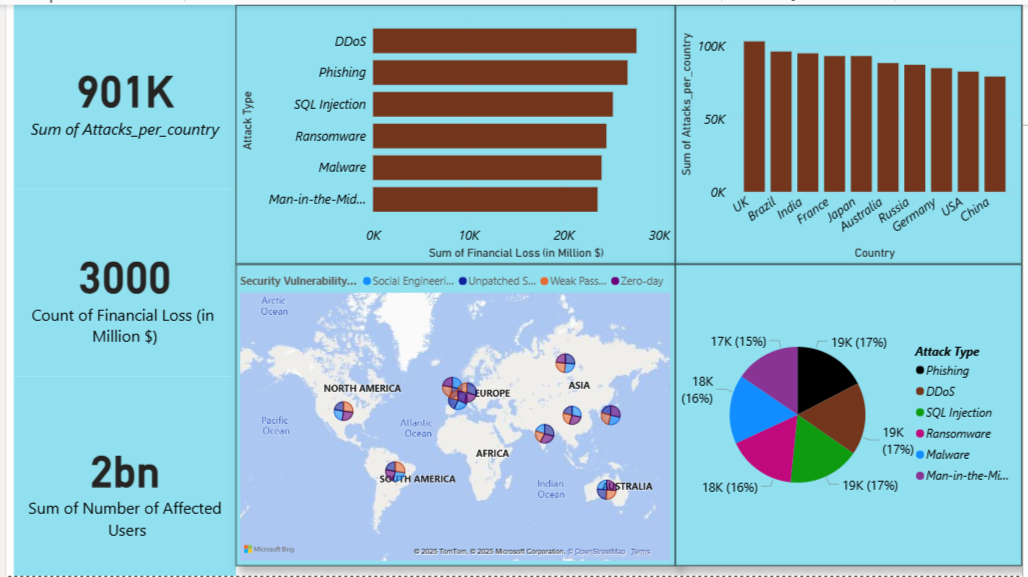
The processed dataset was imported into Power BI for interactive dashboard creation. Key visuals included:
1-Threat distribution by country and industry
2-Yearly trends of attack types
3-Financial loss analysis per threat level
4-Top 10 vulnerable countries and industries
##Example Insights
1-Top 5 countries with the highest number of cyberattacks
2-Most common types of attacks in the finance industry
3-Correlation between threat level and financial loss
4-Year-over-year growth of ransomware attacks
1-File Name: cyber_security_threats.csv
2-Source: Kaggle
3-Rows: (3000)
4-Columns: 13
##Tools Used: 1-Python (Pandas, Matplotlib, Seaborn), Power BI
##Status: Cleaned, analyzed, and visualized
##Features
Feature Description
1-attack_source Origin or initiator of the attack (e.g., botnet, malware, insider). 2-attack_type Type of cyberattack (e.g., DDoS, phishing, ransomware). 3-country Country where the attack was initiated or reported. 4-defence_mechanism Method used to mitigate or respond to the attack. 5-financial_loss Estimated monetary loss due to the attack (USD). 6-incident_resolution_time Time taken to resolve the incident (in hours or days). 7-number_of_affected_user Number of users impacted by the attack. 8-security_vulnerability_type Vulnerability exploited (e.g., SQL injection, zero-day, misconfiguration). 9-target_industry Industry affected (e.g., finance, healthcare, education). 10-year Year of occurrence. 11-threats_level (Added) Custom-calculated level of threat (e.g., Low, Medium, High). 12-attacks_per_country (Added) Aggregated number of attacks per country.
##Use Cases
1-Exploratory Data Analysis (EDA)
2-Trend analysis of cybersecurity threats over the years
3-Predictive modeling of financial loss or resolution time
4-Clustering based on threat levels or regions
5-Visualization dashboards (Power BI, Tableau, etc.)
6-Cybersecurity risk analysis
7-Data storytelling dashboards
8-Machine learning experiments (e.g., predicting financial loss)
9-Corporate threat profiling
##The dataset was cleaned and processed using Python, including:
1-Handling missing values
2-Feature engineering (threats_level, attacks_per_country)
3-Data type conversions
4-Exploratory Data Analysis using Matplotlib & Seaborn
##Visualization
The processed dataset was imported into Power BI for interactive dashboard creation. Key visuals included:
1-Threat distribution by country and industry
2-Yearly trends of attack types
3-Financial loss analysis per threat level
4-Top 10 vulnerable countries and industries
##Example Insights
1-Top 5 countries with the highest number of cyberattacks
2-Most common types of attacks in the finance industry
3-Correlation between threat level and financial loss
4-Year-over-year growth of ransomware attacks