Dashboard in Excel for financial analysis
Data Processing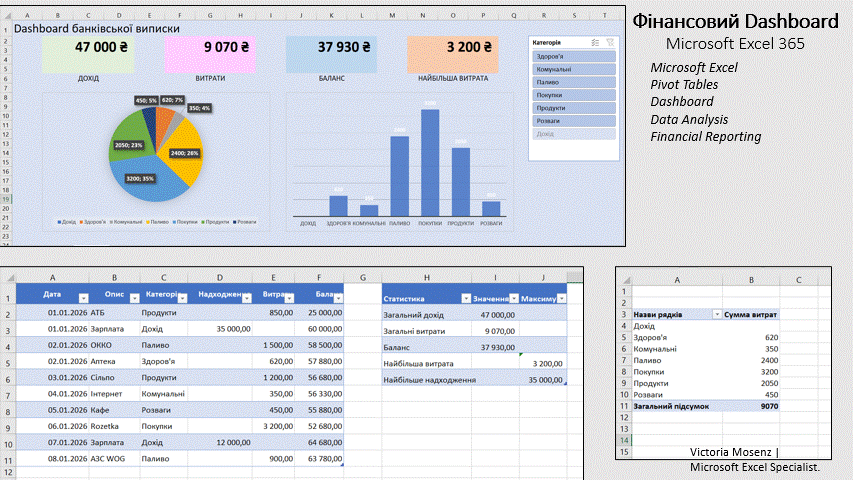
A financial Dashboard has been created in Microsoft Excel for analyzing banking operations. The project includes automatic calculations of income, expenses, balance, identification of the largest expense, pivot tables, charts, and visualization of key indicators. During development, Excel Tables, Pivot Tables, structured references, SUM and MAX functions were used. Such a report can be used for personal finance analysis or financial reporting for small businesses.
Key features:
automatic calculation of income, expenses, and balance;
identification of the largest expense;
keeping a table of banking operations;
expense analysis by categories using a pivot table;
data visualization using pie and bar charts;
displaying key financial indicators on the Dashboard.
Tools used:
Microsoft Excel 365;
Excel Tables;
Pivot Tables;
structured references;
SUM and MAX functions;
data formatting;
Dashboard creation.
Tags:
Microsoft Excel
Dashboard
Data Analysis
Pivot Tables
Financial Reporting
Excel Dashboard
Key features:
automatic calculation of income, expenses, and balance;
identification of the largest expense;
keeping a table of banking operations;
expense analysis by categories using a pivot table;
data visualization using pie and bar charts;
displaying key financial indicators on the Dashboard.
Tools used:
Microsoft Excel 365;
Excel Tables;
Pivot Tables;
structured references;
SUM and MAX functions;
data formatting;
Dashboard creation.
Tags:
Microsoft Excel
Dashboard
Data Analysis
Pivot Tables
Financial Reporting
Excel Dashboard