Development of an analytical report that includes processing raw data in #DWH and visualizing complex business metrics.
Key functionalities:
— Geographic Insights: interactive maps of warehouses and distribution centers;
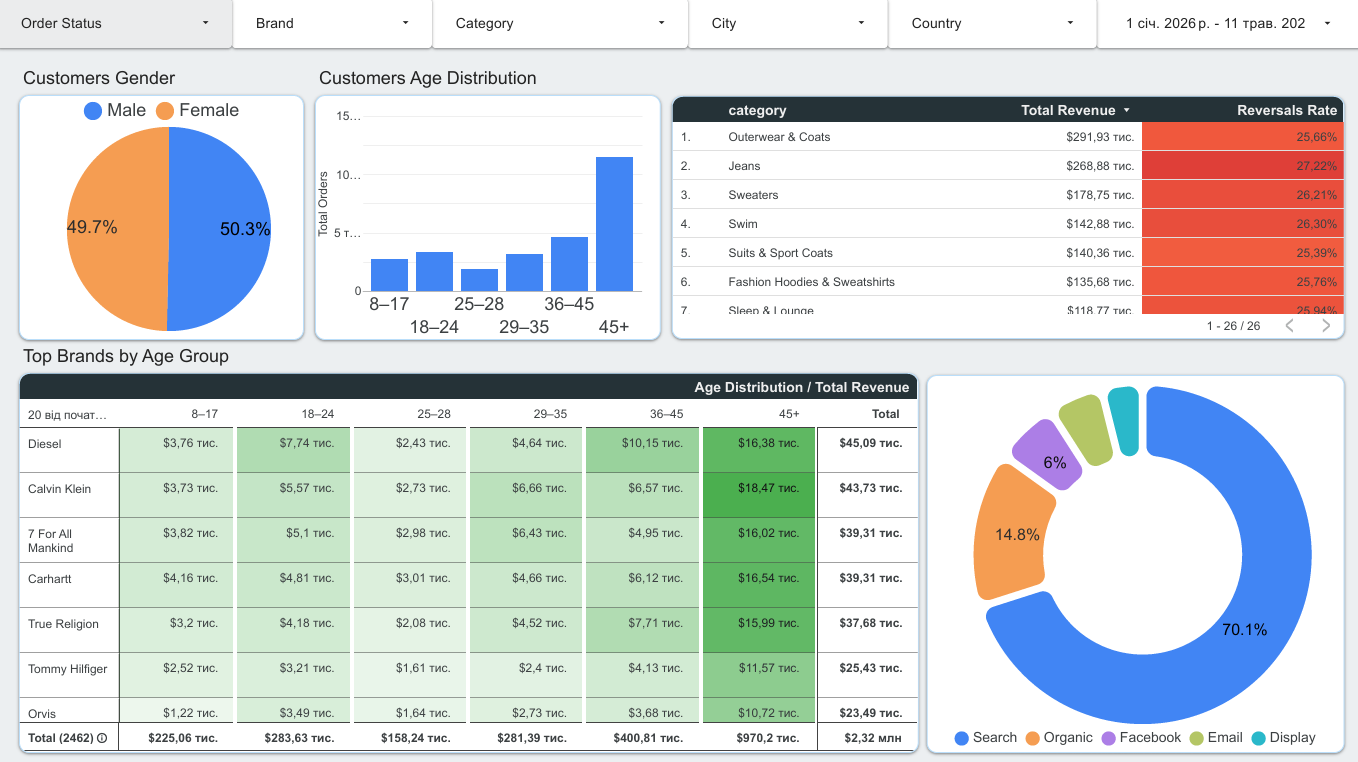
— Operational Analytics: monitoring order statuses, analyzing the share of canceled and returned orders;
— Demographics & Sales: cross-analysis of brands and categories by age groups and gender of customers.
Technical part:
— Writing complex SQL queries in BigQuery;
— Cleaning dirty data (processing text null values, normalizing cities).
— Creating #metrics in Looker Studio for dynamic grouping (Age Buckets, ARPU, etc.).
The tool allows the business to see not only "how much we earned" but also "who our customer is" and the load on logistics centers.
#BigQuery, #SQL, #LookerStudio, #DataVisualization, #Analytics, #BusinessIntelligence
Key functionalities:
— Geographic Insights: interactive maps of warehouses and distribution centers;
— Operational Analytics: monitoring order statuses, analyzing the share of canceled and returned orders;
— Demographics & Sales: cross-analysis of brands and categories by age groups and gender of customers.
Technical part:
— Writing complex SQL queries in BigQuery;
— Cleaning dirty data (processing text null values, normalizing cities).
— Creating #metrics in Looker Studio for dynamic grouping (Age Buckets, ARPU, etc.).
The tool allows the business to see not only "how much we earned" but also "who our customer is" and the load on logistics centers.
#BigQuery, #SQL, #LookerStudio, #DataVisualization, #Analytics, #BusinessIntelligence