Financial KPI dashboard in Google Sheets – Interactive monthly
Data Processing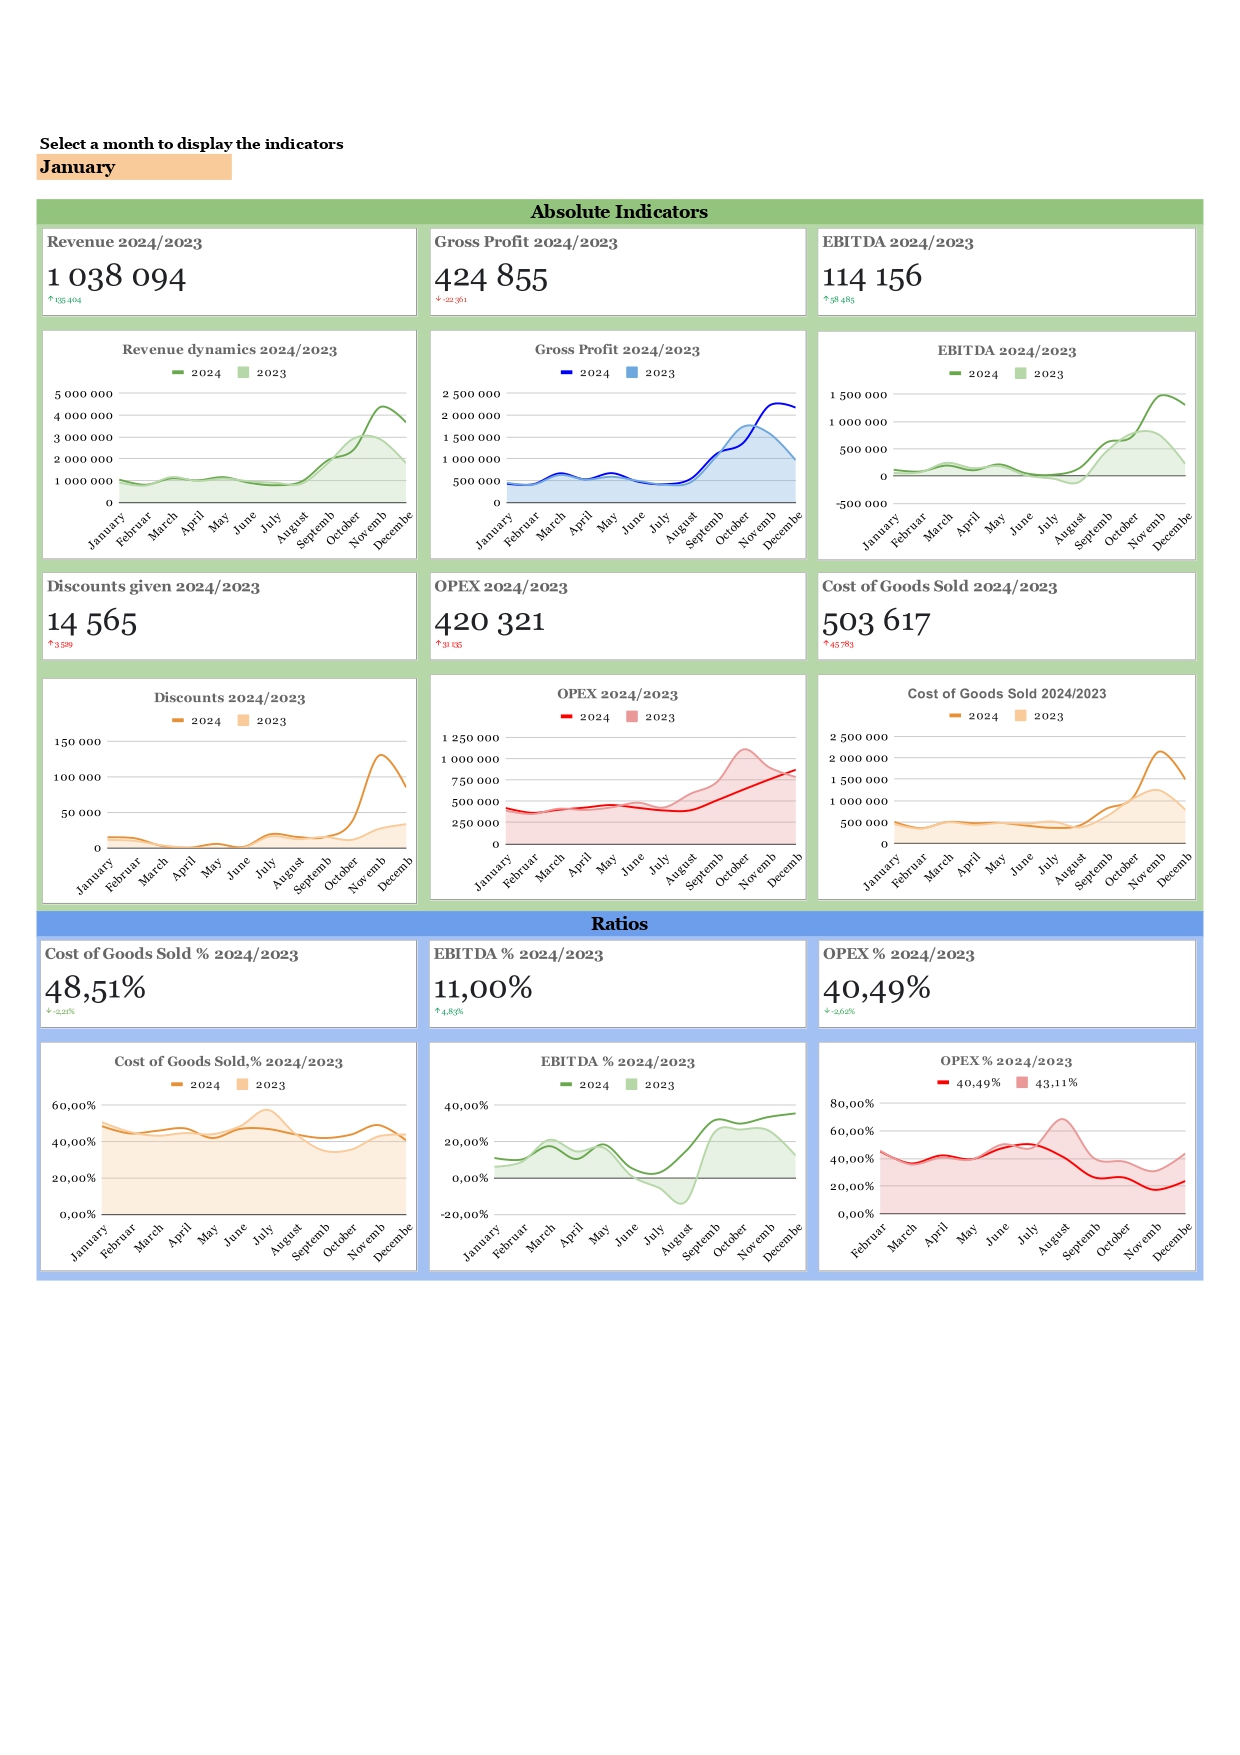
Do you want to always have your business's financial picture at hand — without manual hassle and complicated spreadsheets?
I created an interactive financial dashboard in Google Sheets that automatically updates data on income, expenses, profit, and other important indicators. Just select the desired month — and see everything in numbers and charts.
You don't need to spend hours preparing reports — everything is automated.
This is an ideal solution for entrepreneurs and financiers who value time, accuracy, and want to make decisions based on facts rather than assumptions.
I created an interactive financial dashboard in Google Sheets that automatically updates data on income, expenses, profit, and other important indicators. Just select the desired month — and see everything in numbers and charts.
You don't need to spend hours preparing reports — everything is automated.
This is an ideal solution for entrepreneurs and financiers who value time, accuracy, and want to make decisions based on facts rather than assumptions.