Sales and Revenue Dashboard in Looker Studio
Educational analytical project created within the Data Analytics course.
Task: prepare an interactive dashboard for sales and revenue analysis.
What has been done:
• connected data from PostgreSQL;
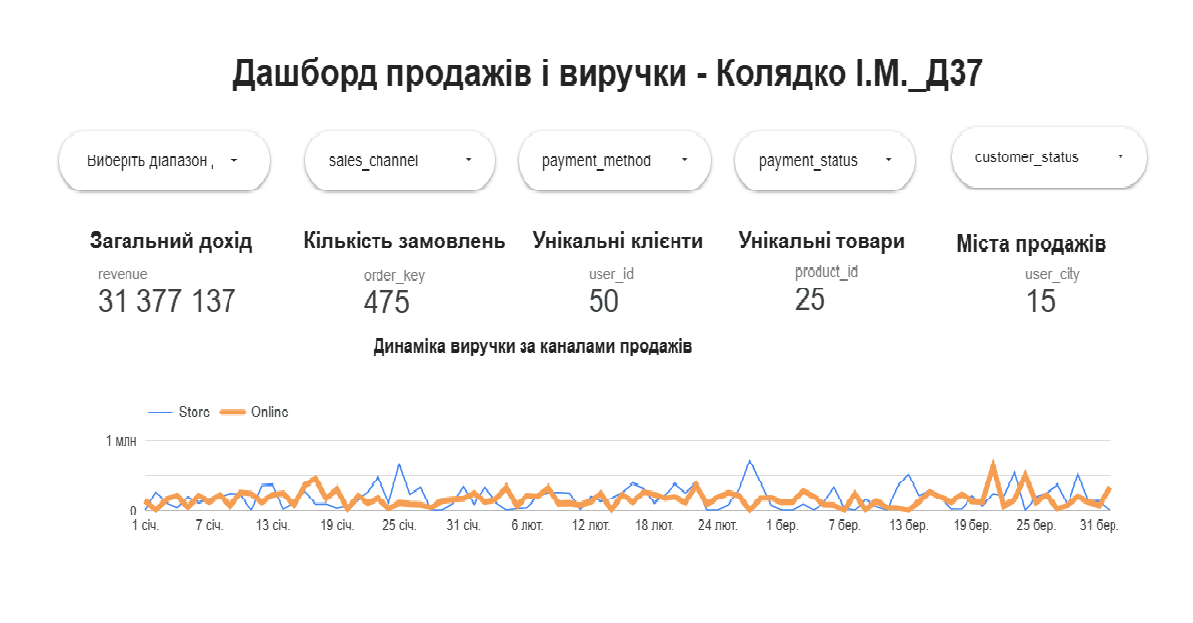
• created key indicators: total revenue, number of orders, unique customers, products, and sales cities;
• added filters by date, sales channel, payment method and status, and customer status;
• built a revenue dynamics chart;
• created a sales map, product table, and customer segments chart.
Tools: Looker Studio, PostgreSQL, SQL.
Result: one interactive report for a quick overview of key sales indicators.
#LookerStudio #DataAnalytics #Dashboard #PostgreSQL #SQL
Task: prepare an interactive dashboard for sales and revenue analysis.
What has been done:
• connected data from PostgreSQL;
• created key indicators: total revenue, number of orders, unique customers, products, and sales cities;
• added filters by date, sales channel, payment method and status, and customer status;
• built a revenue dynamics chart;
• created a sales map, product table, and customer segments chart.
Tools: Looker Studio, PostgreSQL, SQL.
Result: one interactive report for a quick overview of key sales indicators.
#LookerStudio #DataAnalytics #Dashboard #PostgreSQL #SQL
 Rovno
Rovno