Dashboard
Infographics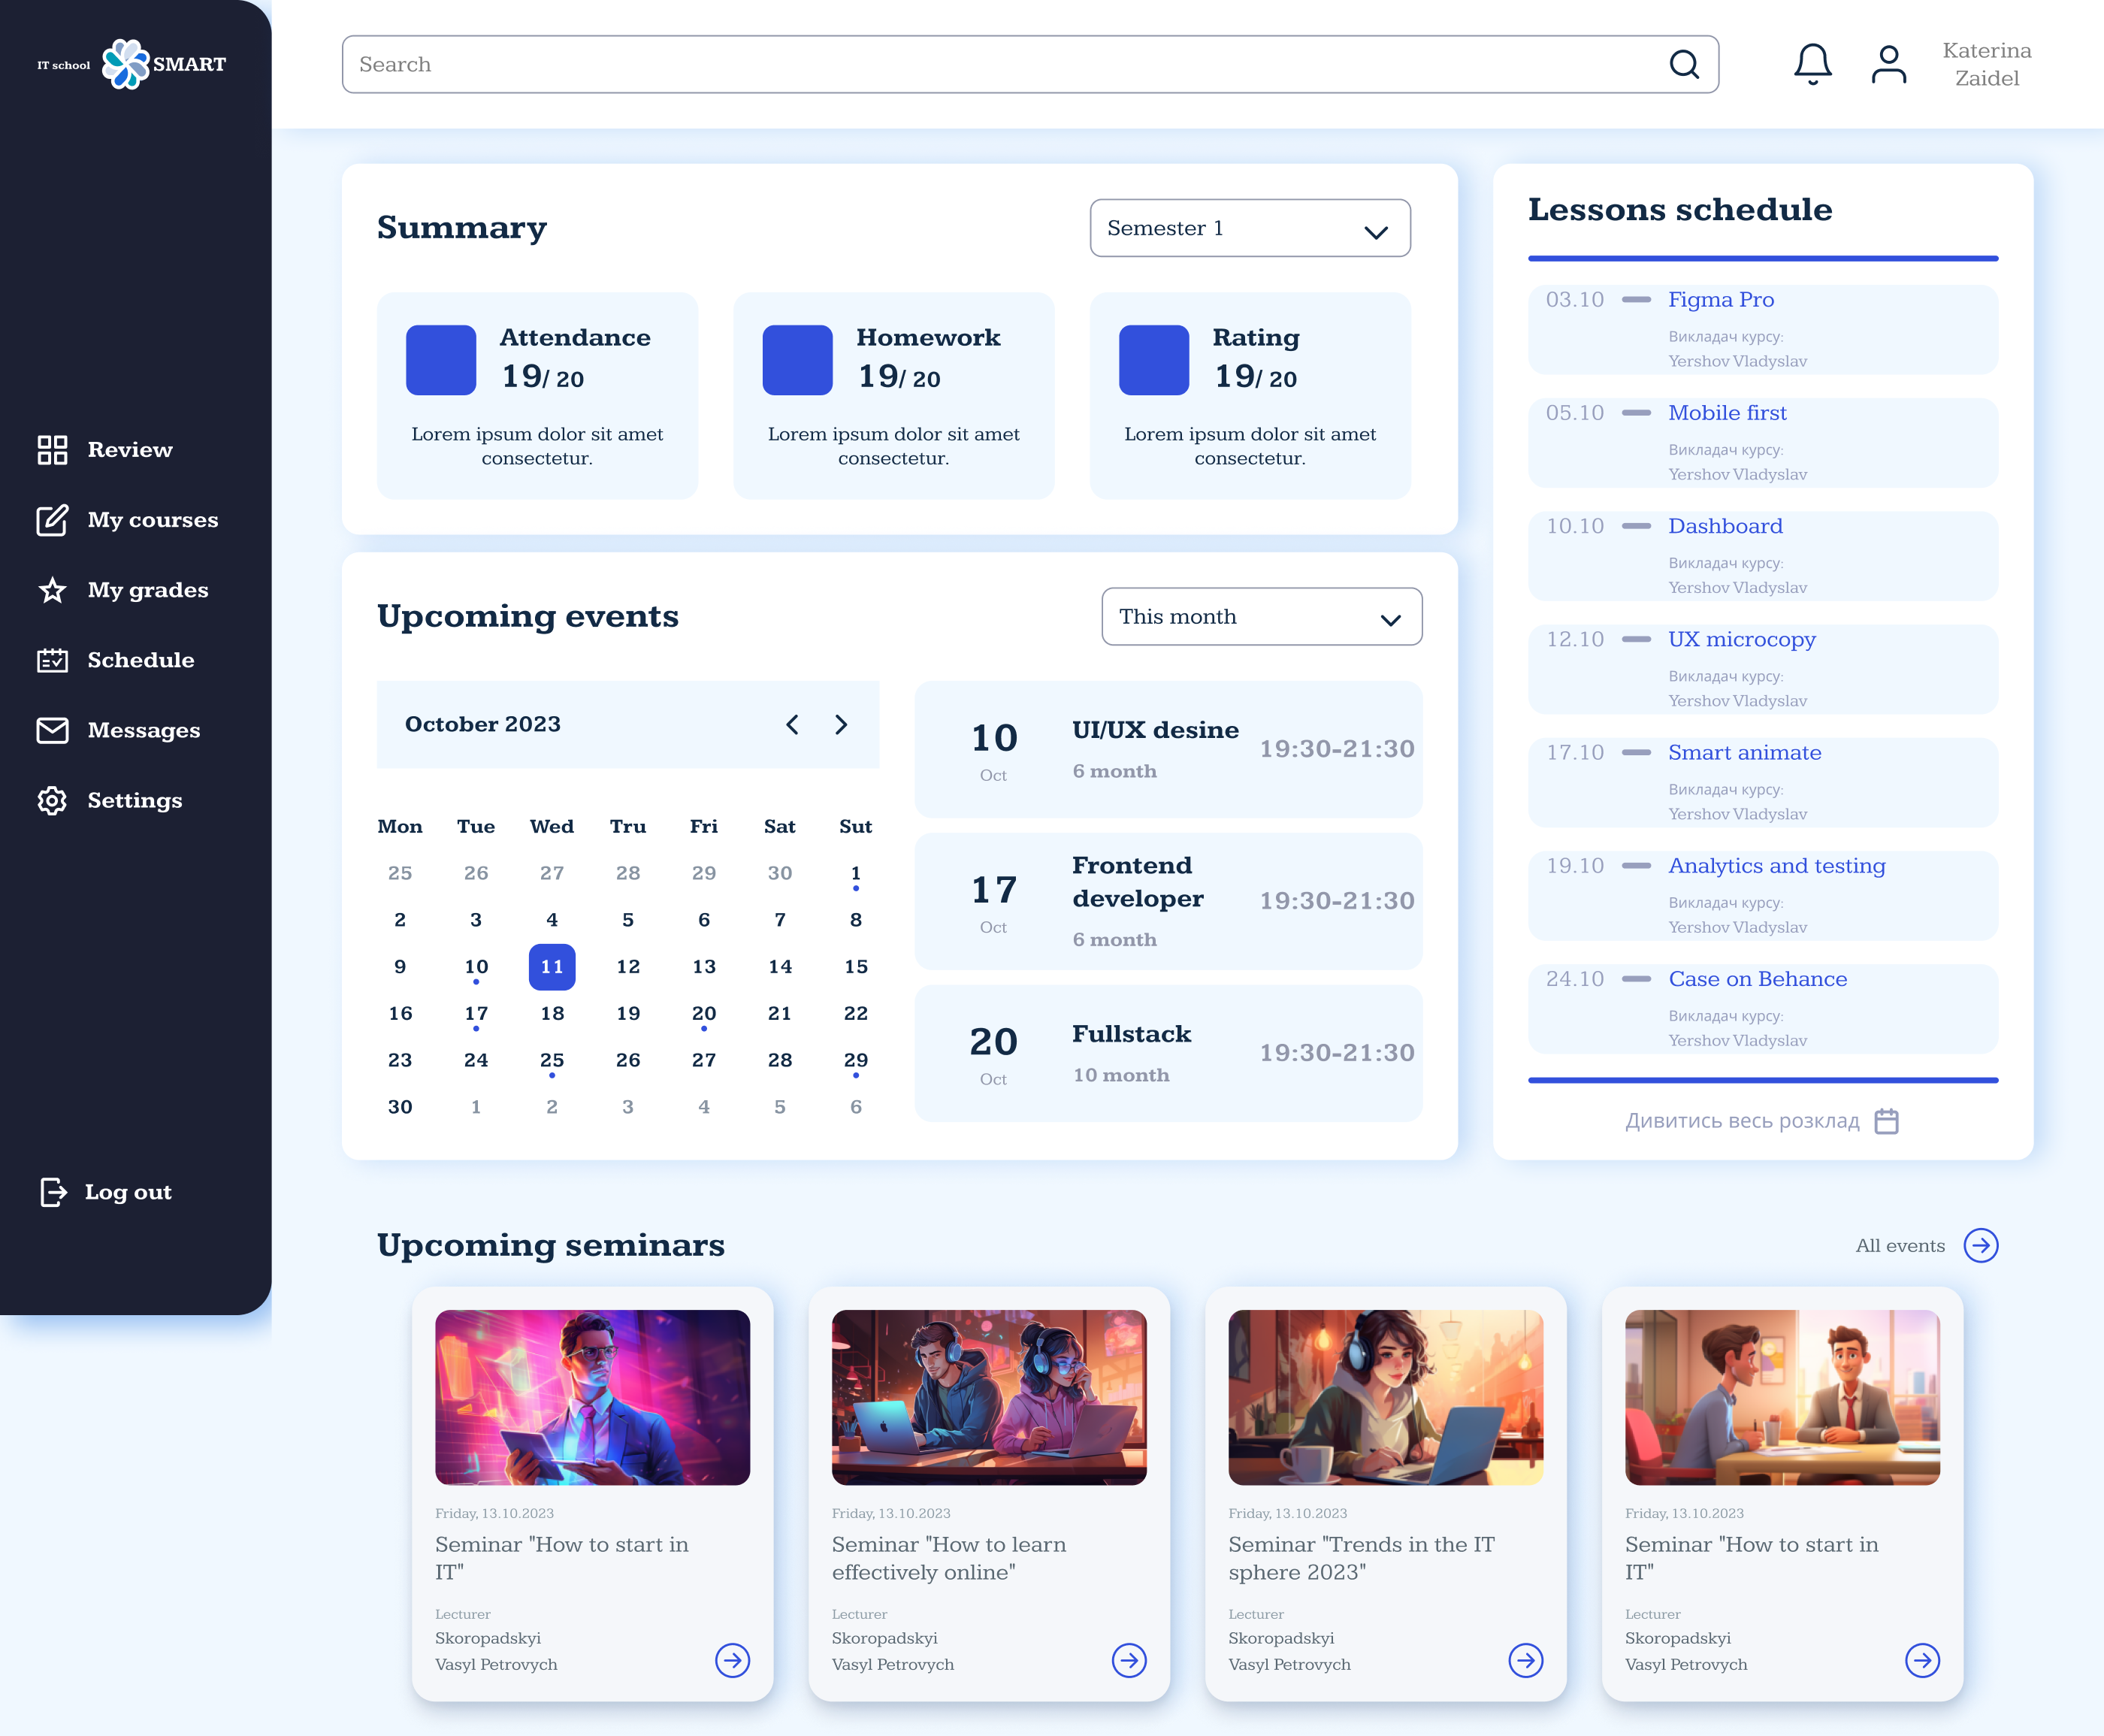
#infographic
Welcome to our interactive dashboard, designed specifically for the IT school. Here you will find key performance indicators of students, attendance records, and progress in various courses. The dashboard allows teachers and administrators to quickly analyze results and identify areas needing improvement. With data visualization tools, you can make informed decisions to enhance the learning process. The dashboard updates in real-time, providing accurate and up-to-date information for all users
Welcome to our interactive dashboard, designed specifically for the IT school. Here you will find key performance indicators of students, attendance records, and progress in various courses. The dashboard allows teachers and administrators to quickly analyze results and identify areas needing improvement. With data visualization tools, you can make informed decisions to enhance the learning process. The dashboard updates in real-time, providing accurate and up-to-date information for all users