Dashboard with custom tooltip block
Data Processing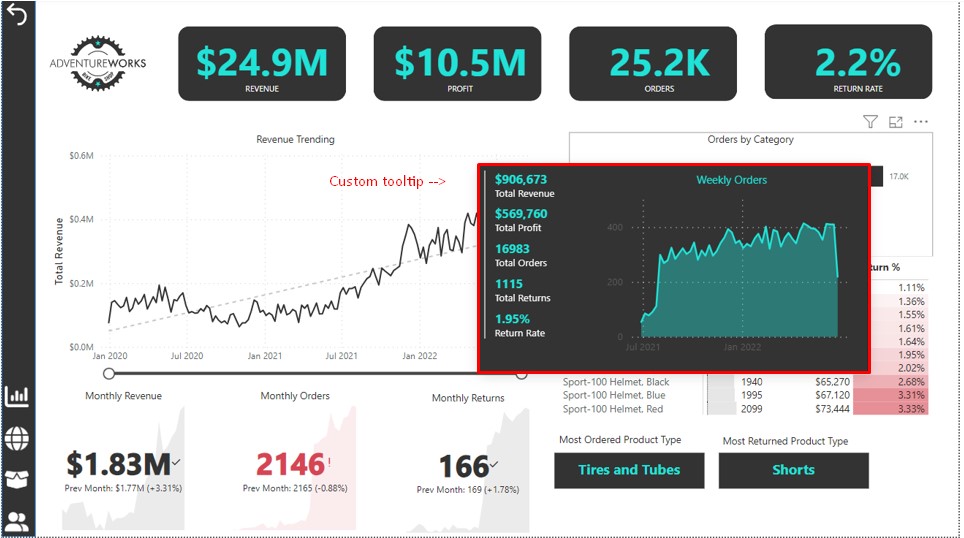
Work is added to illustrate the possibilities.
You can add a tooltip block with data to any chart. The data will be different depending on the selected point on the graph. By default, this is the value of the indicator of the selected point (for example, the amount of sales for a specific day). But you can customize it: for example, show a breakdown of sales by category. Add a pop-up graph with dynamics for any other parameter. The tooltip block will not overload the dashboard, but will expand the analytics capabilities.
Design, data set, metrics - everything changes depending on your task.
#PowerBI #Dashboard #DAX #PowerQuery
You can add a tooltip block with data to any chart. The data will be different depending on the selected point on the graph. By default, this is the value of the indicator of the selected point (for example, the amount of sales for a specific day). But you can customize it: for example, show a breakdown of sales by category. Add a pop-up graph with dynamics for any other parameter. The tooltip block will not overload the dashboard, but will expand the analytics capabilities.
Design, data set, metrics - everything changes depending on your task.
#PowerBI #Dashboard #DAX #PowerQuery