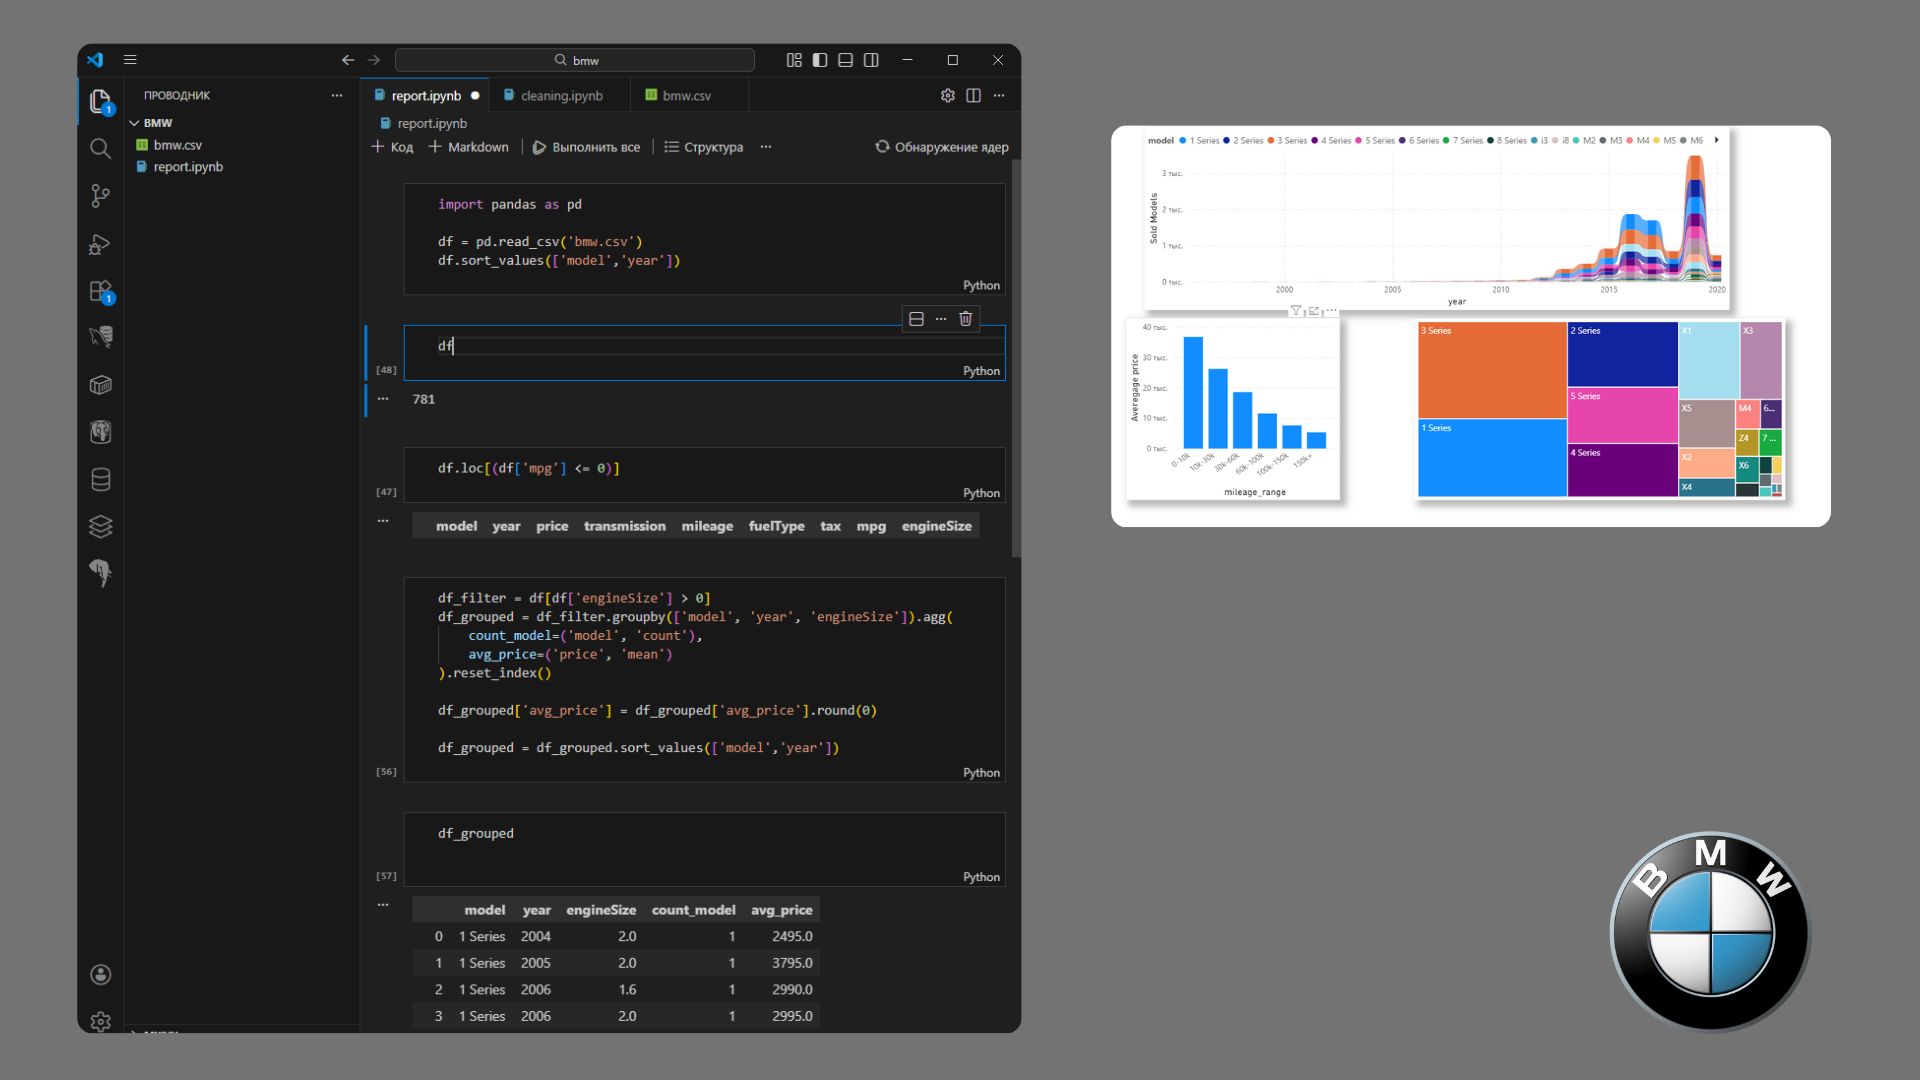
I created a small data visualization of BMW car sales since 1997. This helped me choose a car with the best price-to-quality ratio, as well as determine the price-to-mileage ratio.
After visualizing and processing the data, I realized that for every 10,000 miles, the price decreases by 6-10%. I also noted the best-selling car models for each year.
After visualizing and processing the data, I realized that for every 10,000 miles, the price decreases by 6-10%. I also noted the best-selling car models for each year.