How to read this infographic? Now I will break it down into sections.
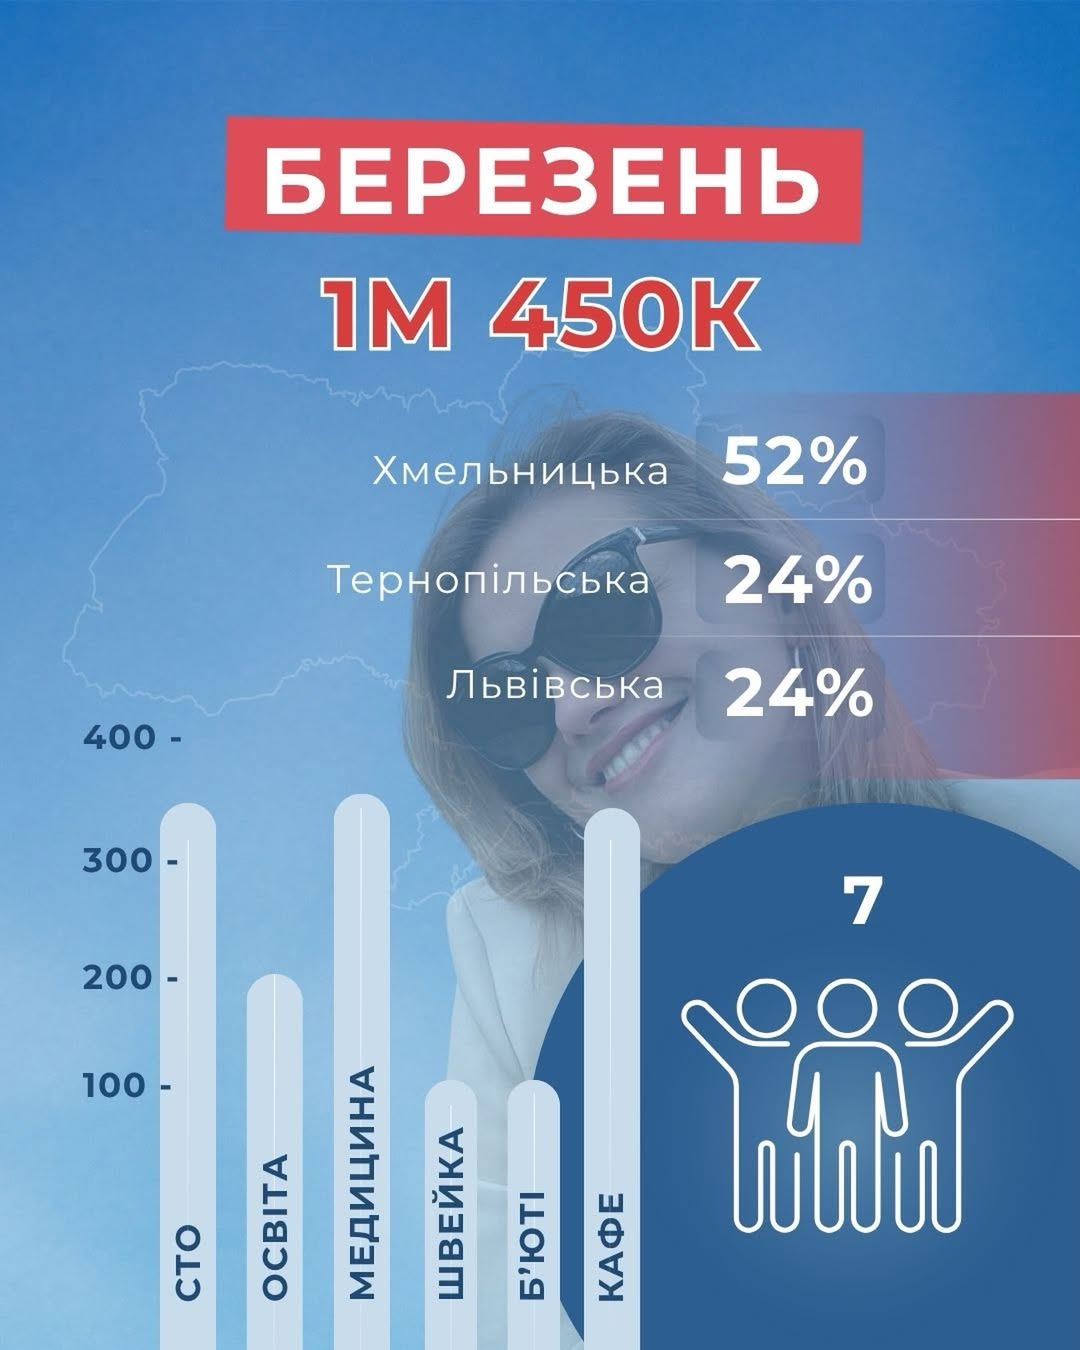
1. Top section — total amount and period
Here you see the main point: how much grant funding we attracted for clients in a month. In this case — 1 million 450 thousand UAH for March.
This is about the scale of work and real results, not "we are doing something."
2. Geography (GEO)
Shows in which regions our clients received funding:
Khmelnytskyi — 52%
Ternopil — 24%
Lviv — 24%
This is important because: it shows that we are not working in just one city; grants are actually coming into different regions; you can "try it on" for yourself: does this work for my region? — yes.
3. Business niches
This section shows which sectors we worked with and where the funds went: auto repair, education, medicine, tailoring, beauty, cafes.
Why this is interesting: you see that this is not "one magical niche"; you can find yourself and understand: I can also do this; it removes the fear that "grants are not for my business."
4. Employment
The last section shows how many people got jobs thanks to these grants. In this case — 7 people.
And this is a very underrated indicator because:
grants = not only money, but also new jobs;
it is a real impact of business on the economy;
it is an argument that often decides the fate of the application.
Thank you to the team, and we look forward to the new report in a month.