Interactive Profit Chart in Google Tables
Data Processing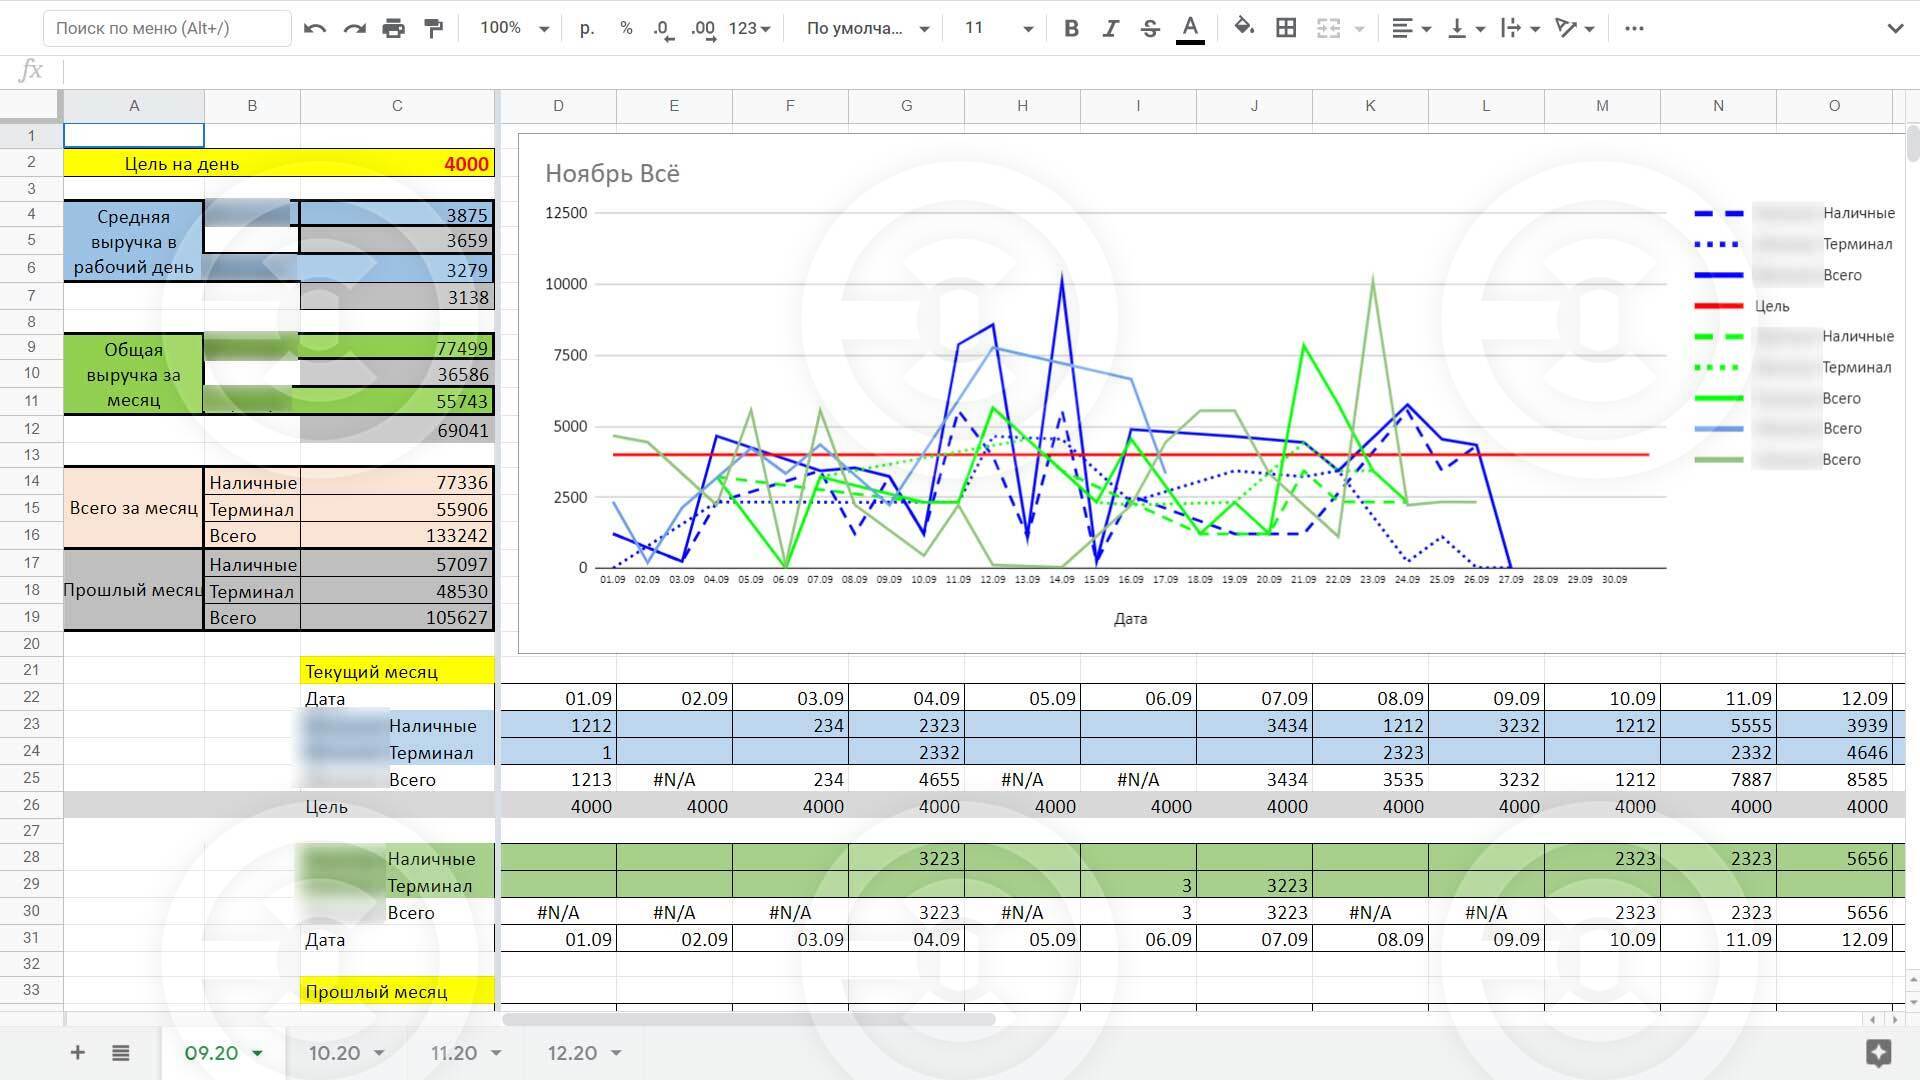
The chart reflects the data on the daily income (common, unknown, cash) for the current month, as well as the curve of the income for the last month + the daily goal.
All data are entered for two sellers separately.
The schedule and general table are built automatically - the seller is sufficient to enter only the income per day.
#excel #table #GoogleSheets #GoogleTables #grafics #recounting #recounting #recounting
All data are entered for two sellers separately.
The schedule and general table are built automatically - the seller is sufficient to enter only the income per day.
#excel #table #GoogleSheets #GoogleTables #grafics #recounting #recounting #recounting