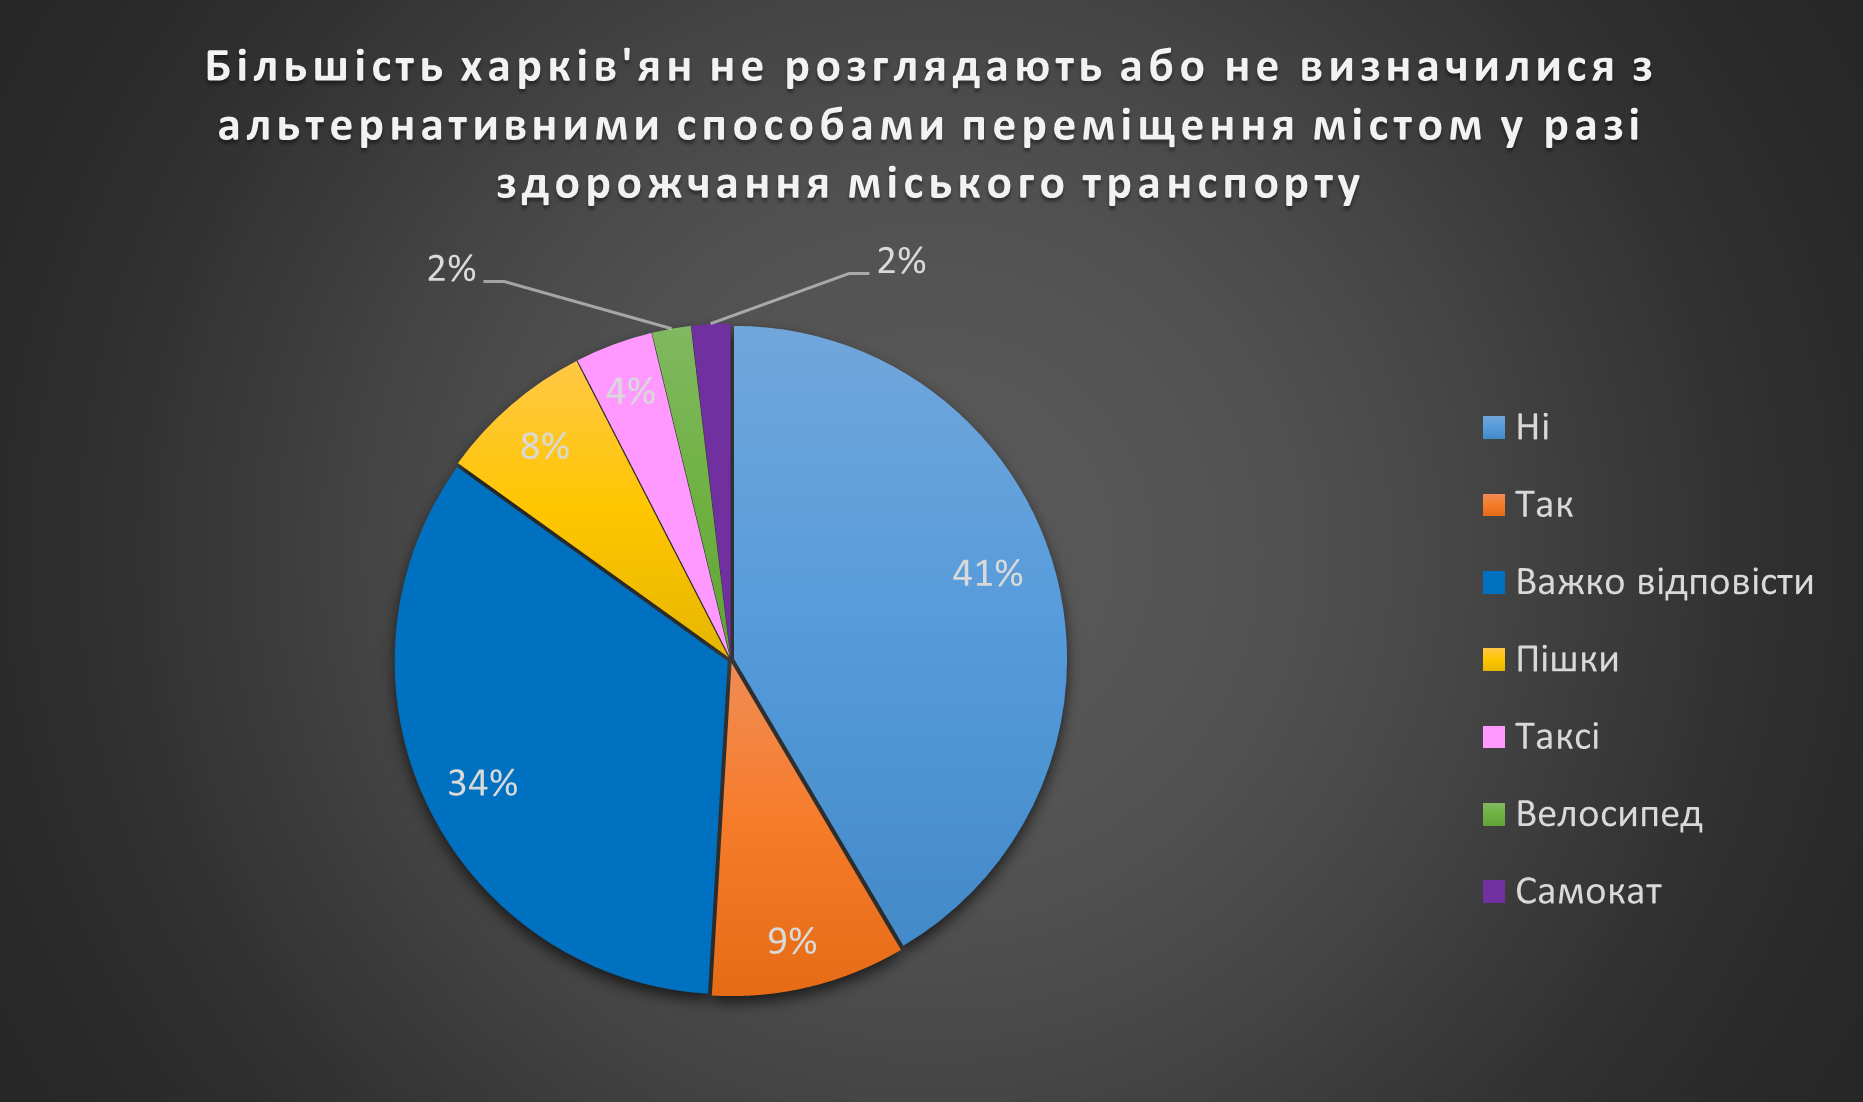
A pie chart is a way of visualizing data in the form of a circle divided into sectors. Each sector shows the share of a specific category from the total sum. The title is chosen in such a way that it provides summary information about the data, rather than just naming the data: graph, frequency, number of passengers, etc.