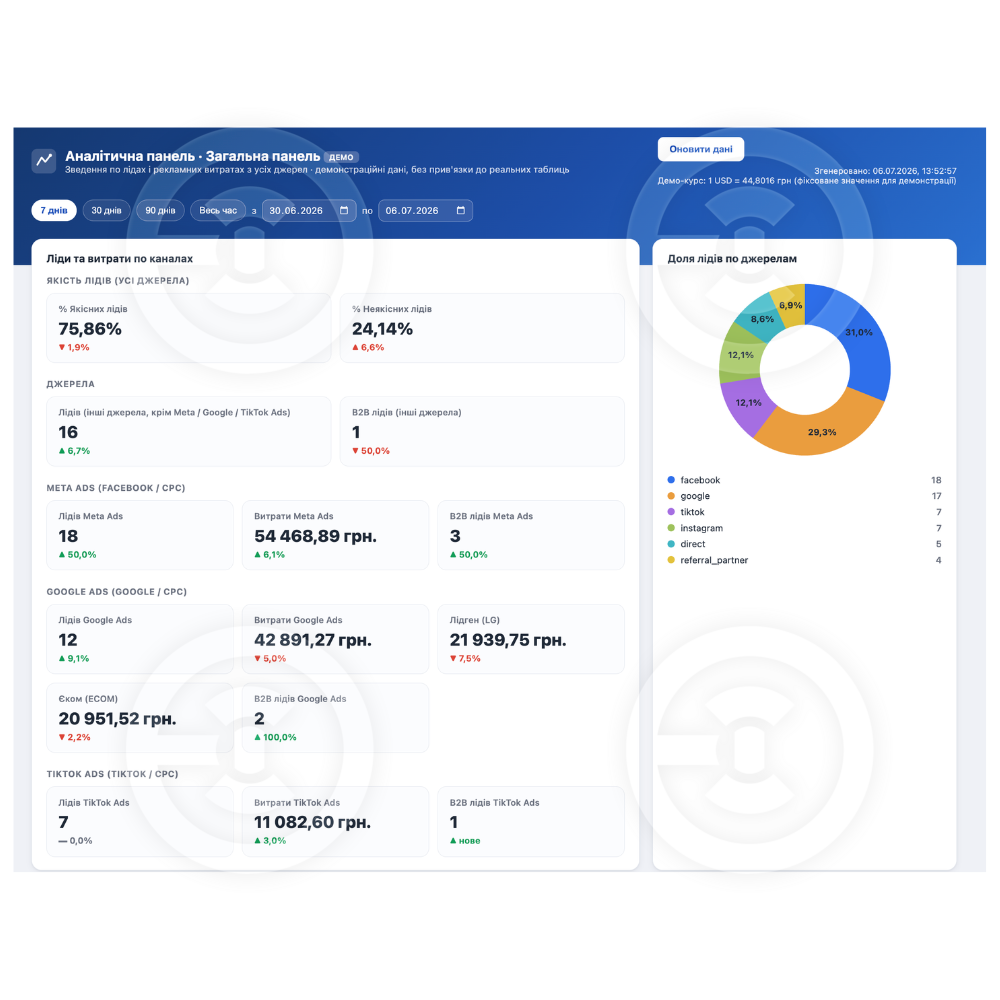
Custom analytical dashboard for lead generation — Google Ads, Meta, TikTok + CRM + manager efficiency
When leads are present but sales are low, the issue may not be with the advertising but with what happens after the click. This system shows the complete chain: from the traffic source to the deal and the reasons for rejection.
What is included in the system:
— Overall dashboard: leads and expenses across all channels, B2B/B2C share, lead quality by sources
— Google Ads dashboard: breakdown by campaigns, cost per quality lead, cost per B2B lead, deals
— Meta (Facebook) dashboard: similar structure, expenses in USD, breakdown by utm_campaign
— TikTok dashboard: leads, quality/unquality, cost per B2B lead, deals by campaigns
— Traffic sources: summary table by utm_source / utm_medium — where quality is higher, where it is lower
— Managers: distribution of leads among managers, rejection percentage for each, reasons for rejection in absolute values
Why this is important:
One manager closes 60% of leads, another 25%. If you don't see this, you are paying the same for different results. The system shows where money is really lost: in advertising or in lead processing.
Fully custom, adaptive, without limitations of Looker Studio. Demo available at the link — you can test all functionality directly in the browser.
When leads are present but sales are low, the issue may not be with the advertising but with what happens after the click. This system shows the complete chain: from the traffic source to the deal and the reasons for rejection.
What is included in the system:
— Overall dashboard: leads and expenses across all channels, B2B/B2C share, lead quality by sources
— Google Ads dashboard: breakdown by campaigns, cost per quality lead, cost per B2B lead, deals
— Meta (Facebook) dashboard: similar structure, expenses in USD, breakdown by utm_campaign
— TikTok dashboard: leads, quality/unquality, cost per B2B lead, deals by campaigns
— Traffic sources: summary table by utm_source / utm_medium — where quality is higher, where it is lower
— Managers: distribution of leads among managers, rejection percentage for each, reasons for rejection in absolute values
Why this is important:
One manager closes 60% of leads, another 25%. If you don't see this, you are paying the same for different results. The system shows where money is really lost: in advertising or in lead processing.
Fully custom, adaptive, without limitations of Looker Studio. Demo available at the link — you can test all functionality directly in the browser.