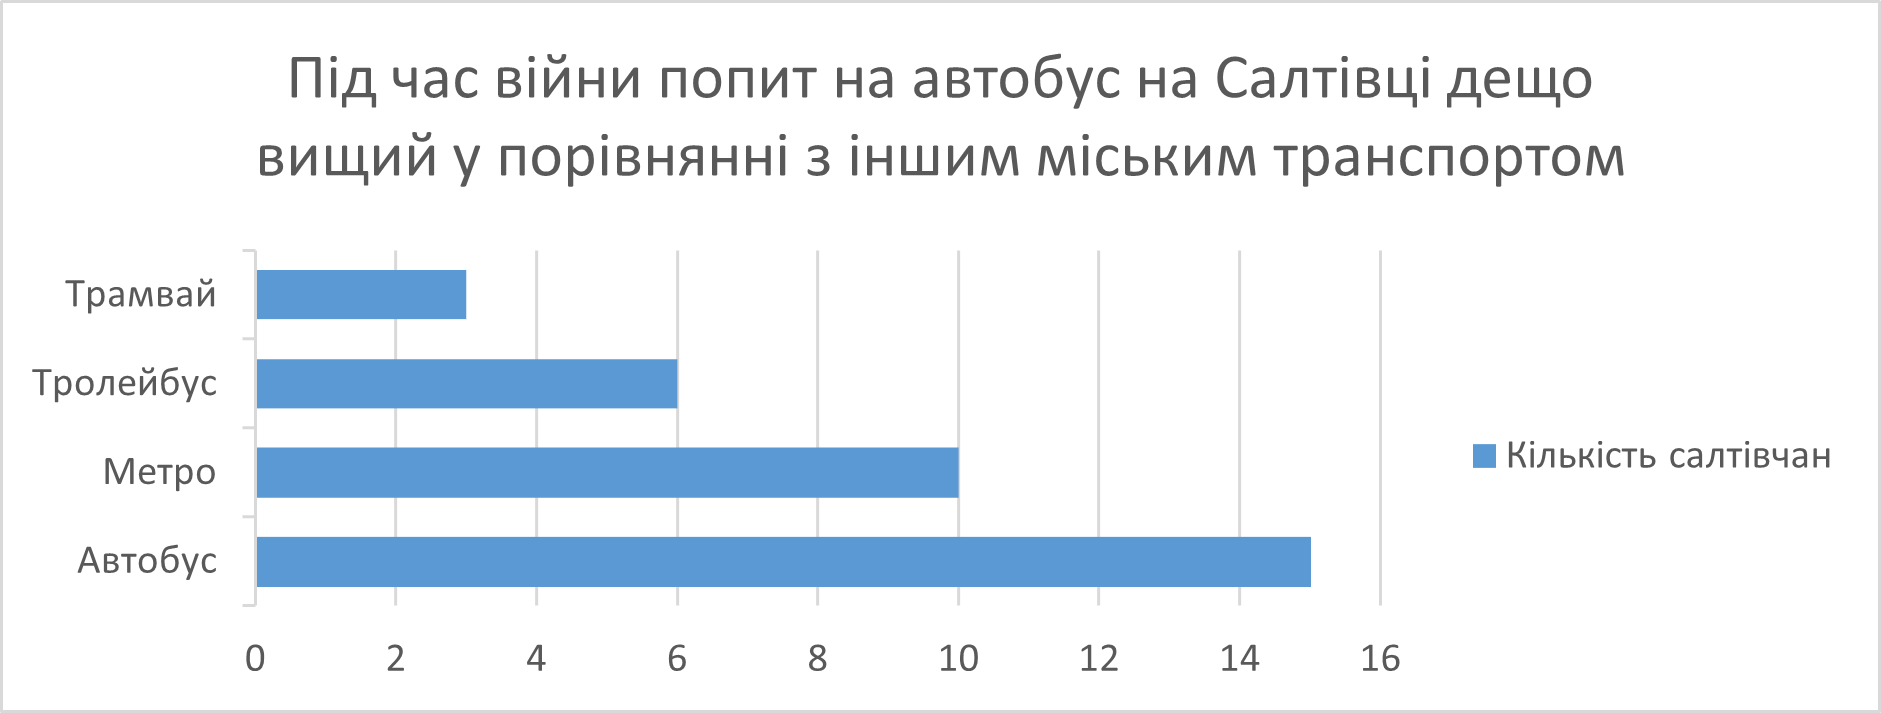
A linear (or line) diagram shows the change of an indicator over time or in a sequence of values. The title is chosen in such a way that it provides summary information about the data, rather than just naming them: graph, frequency, number of passengers, etc.
#visualization #data_visualization #diagram
#visualization #data_visualization #diagram