Analytical case study on user behavior of an e-commerce site: from the first visit to the final purchase. The goal is to identify stages with the highest customer loss and find points to increase site conversion.
Technology stack
Google BigQuery and SQL: data cleaning, aggregation, and calculation of product metrics.
Looker Studio: development of an interactive BI dashboard for visualization.
Key results and insights
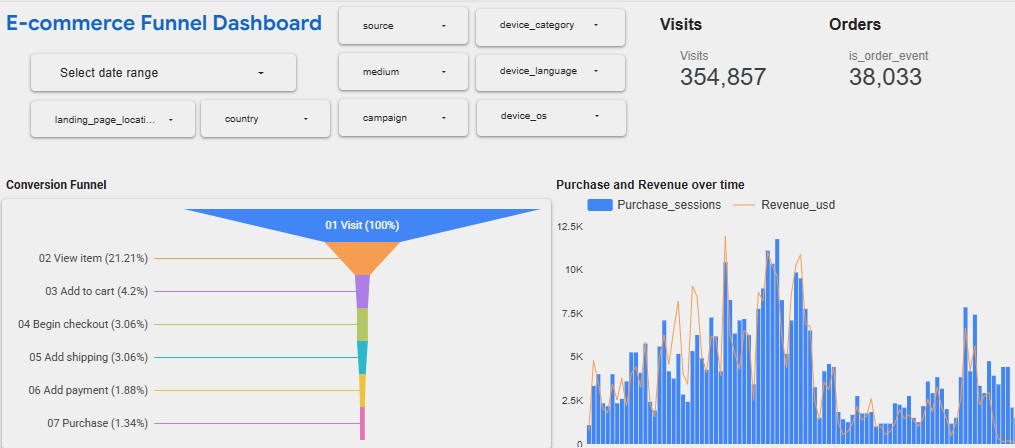
A 7-stage sales funnel has been built, revealing the weakest link — the transition from product view to cart.
Key KPIs calculated: CR to Add to Cart (12.5%) and overall CR to Purchase (3.4%).
Behavioral anomalies identified: mobile traffic shows high interest but low conversion to payment; organic traffic demonstrates the best retention.
8 filters (dates, devices, acquisition channels) integrated for self-service data exploration by marketers.
#lookerstudio #sql #bigquery #ga4 #ecommerce #marketing #github #dashboard #analytics #analytics #marketing #dashboard #webanalytics
Technology stack
Google BigQuery and SQL: data cleaning, aggregation, and calculation of product metrics.
Looker Studio: development of an interactive BI dashboard for visualization.
Key results and insights
A 7-stage sales funnel has been built, revealing the weakest link — the transition from product view to cart.
Key KPIs calculated: CR to Add to Cart (12.5%) and overall CR to Purchase (3.4%).
Behavioral anomalies identified: mobile traffic shows high interest but low conversion to payment; organic traffic demonstrates the best retention.
8 filters (dates, devices, acquisition channels) integrated for self-service data exploration by marketers.
#lookerstudio #sql #bigquery #ga4 #ecommerce #marketing #github #dashboard #analytics #analytics #marketing #dashboard #webanalytics