Installed and configured Prometheus to monitor resources.
Wrote Prometheus configuration file to define target metrics.
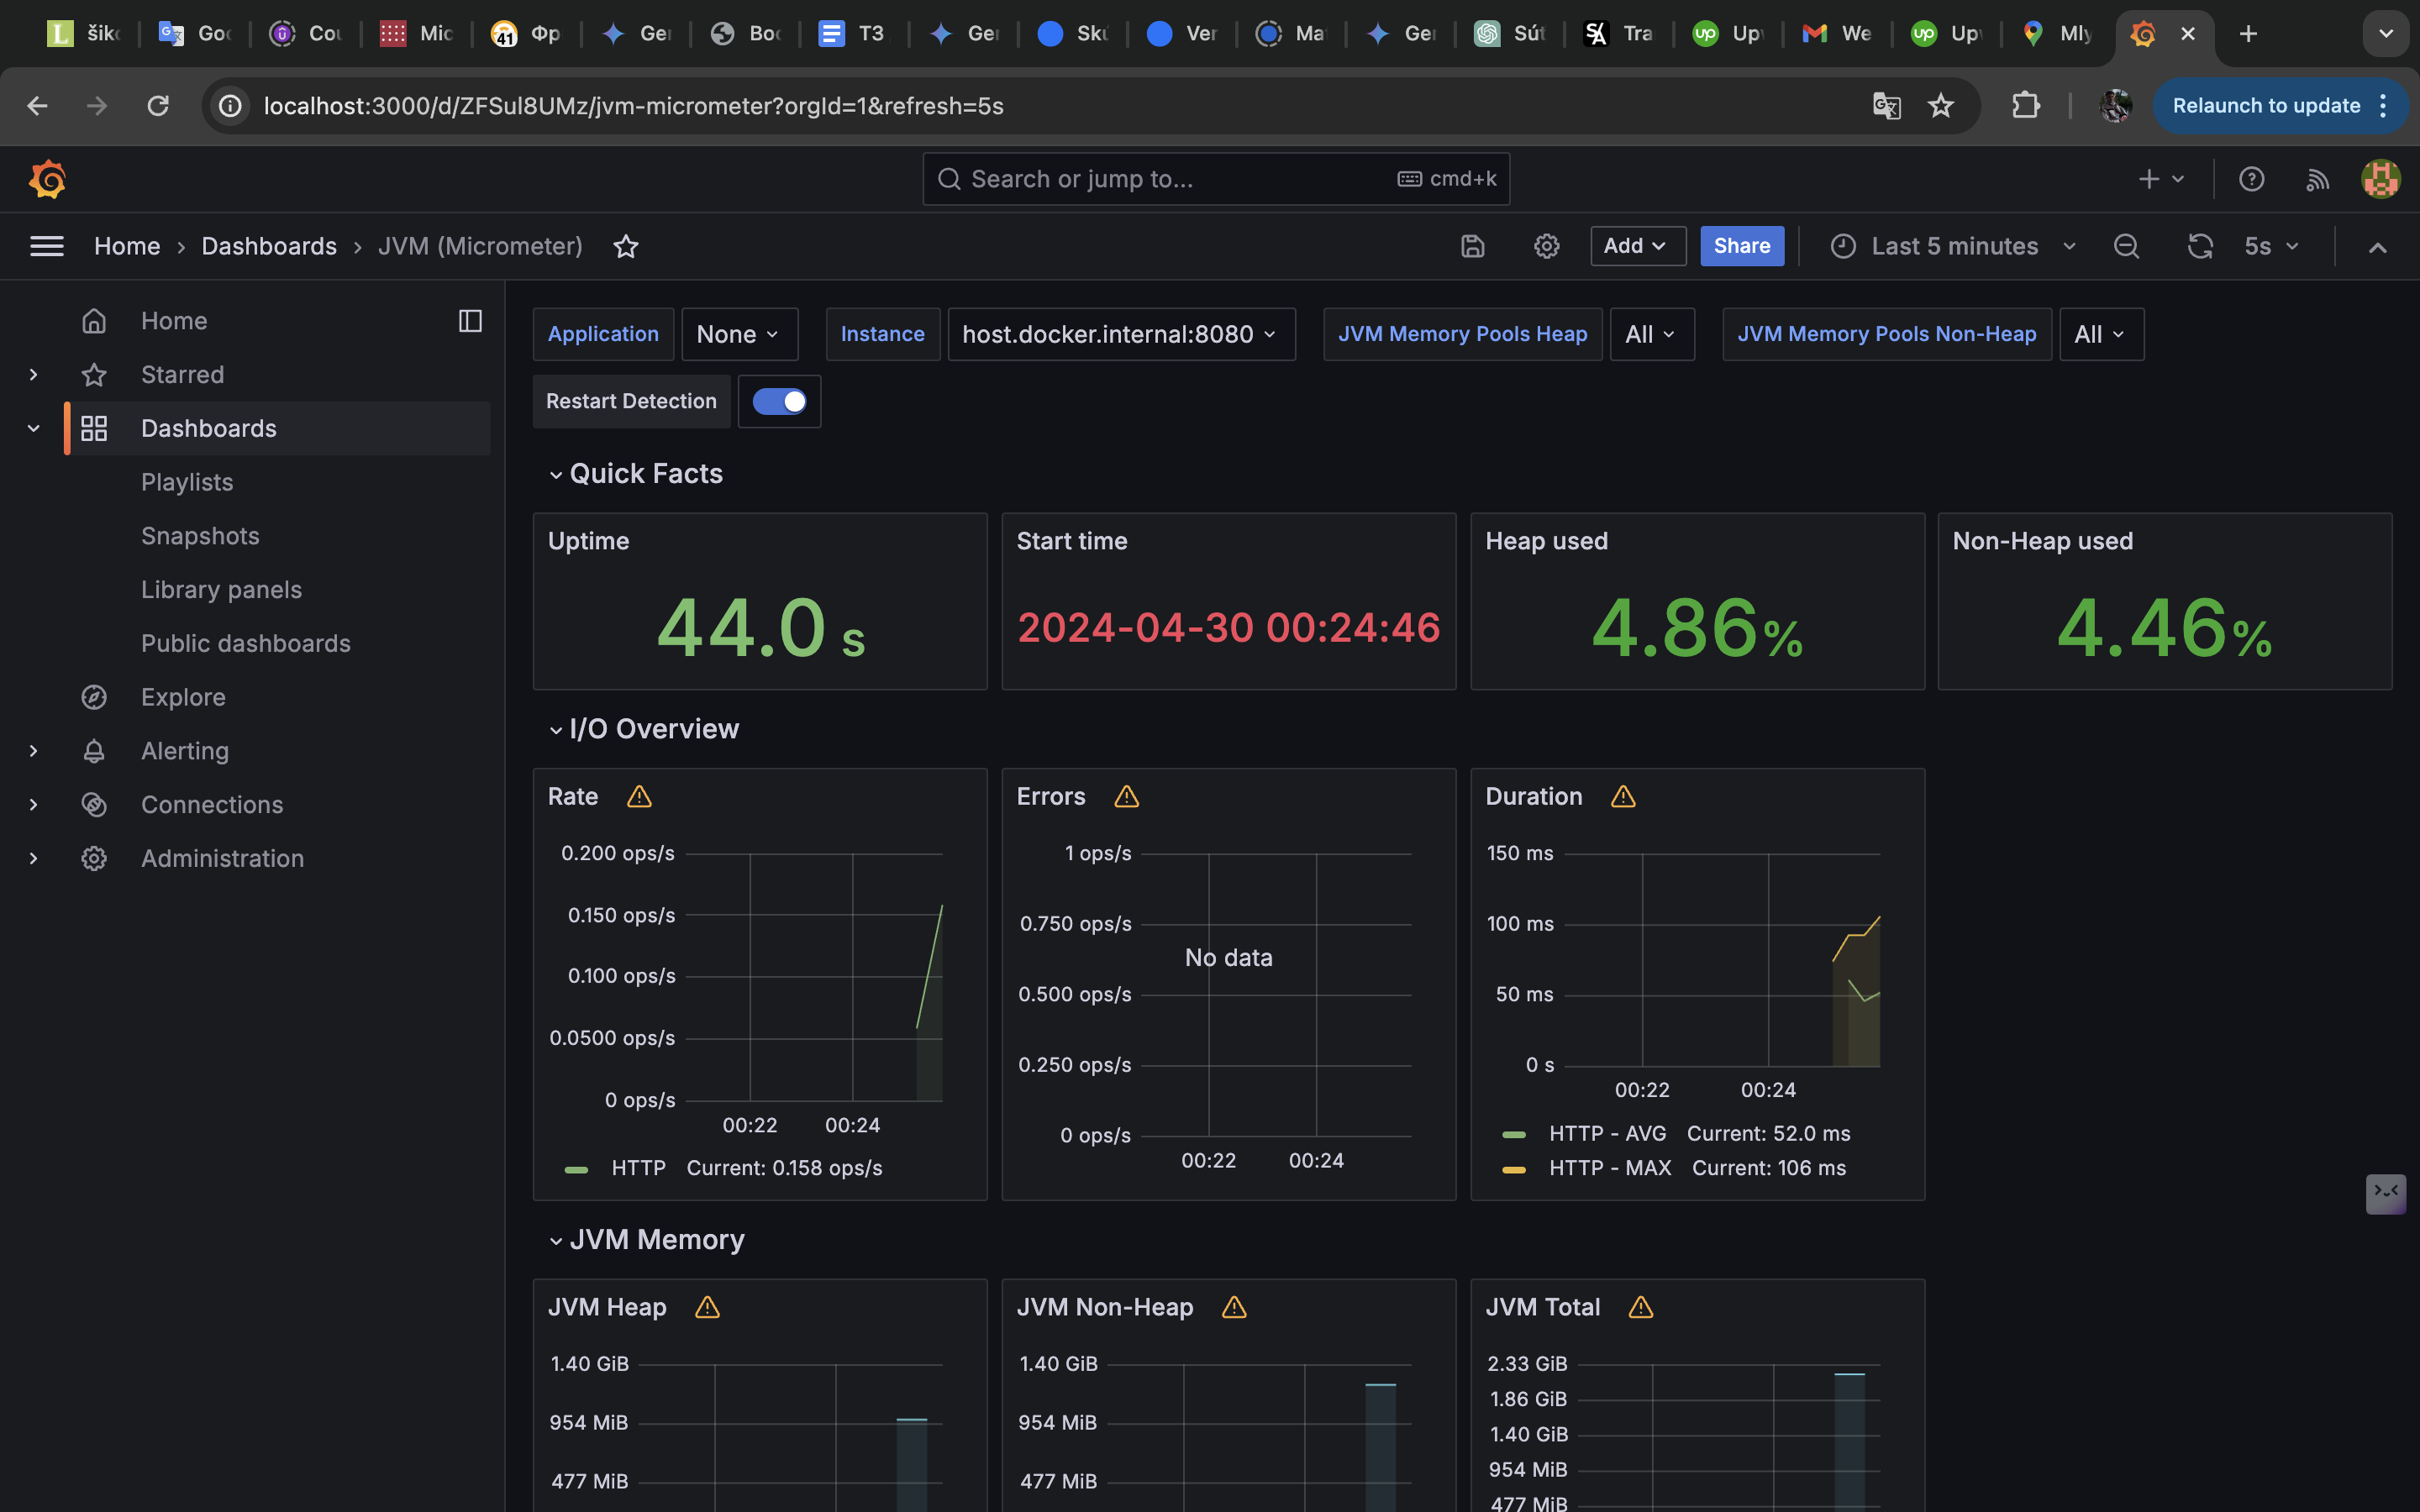
Monitoring of the use of RAM, processor, number of active threads and request execution time is configured.
Installed and configured Grafana to display metrics collected by Prometheus.
Configured Grafana connection to Prometheus data source.
Created and configured dashboards to display important metrics.
Wrote a Docker file to raise all services:
Created Dockerfile for each service (Prometheus, Grafana).
Wrote Docker-compose file to run all containers and set dependencies between them.
A short ReadMe is written:
Explains how to start these services using Docker-compose.
The ports on which the services are running are indicated (for example, Prometheus - port 9090, Grafana - port 3000).
Wrote Prometheus configuration file to define target metrics.
Monitoring of the use of RAM, processor, number of active threads and request execution time is configured.
Installed and configured Grafana to display metrics collected by Prometheus.
Configured Grafana connection to Prometheus data source.
Created and configured dashboards to display important metrics.
Wrote a Docker file to raise all services:
Created Dockerfile for each service (Prometheus, Grafana).
Wrote Docker-compose file to run all containers and set dependencies between them.
A short ReadMe is written:
Explains how to start these services using Docker-compose.
The ports on which the services are running are indicated (for example, Prometheus - port 9090, Grafana - port 3000).