Monitoring system for the restaurant business
Interface Design (UI/UX)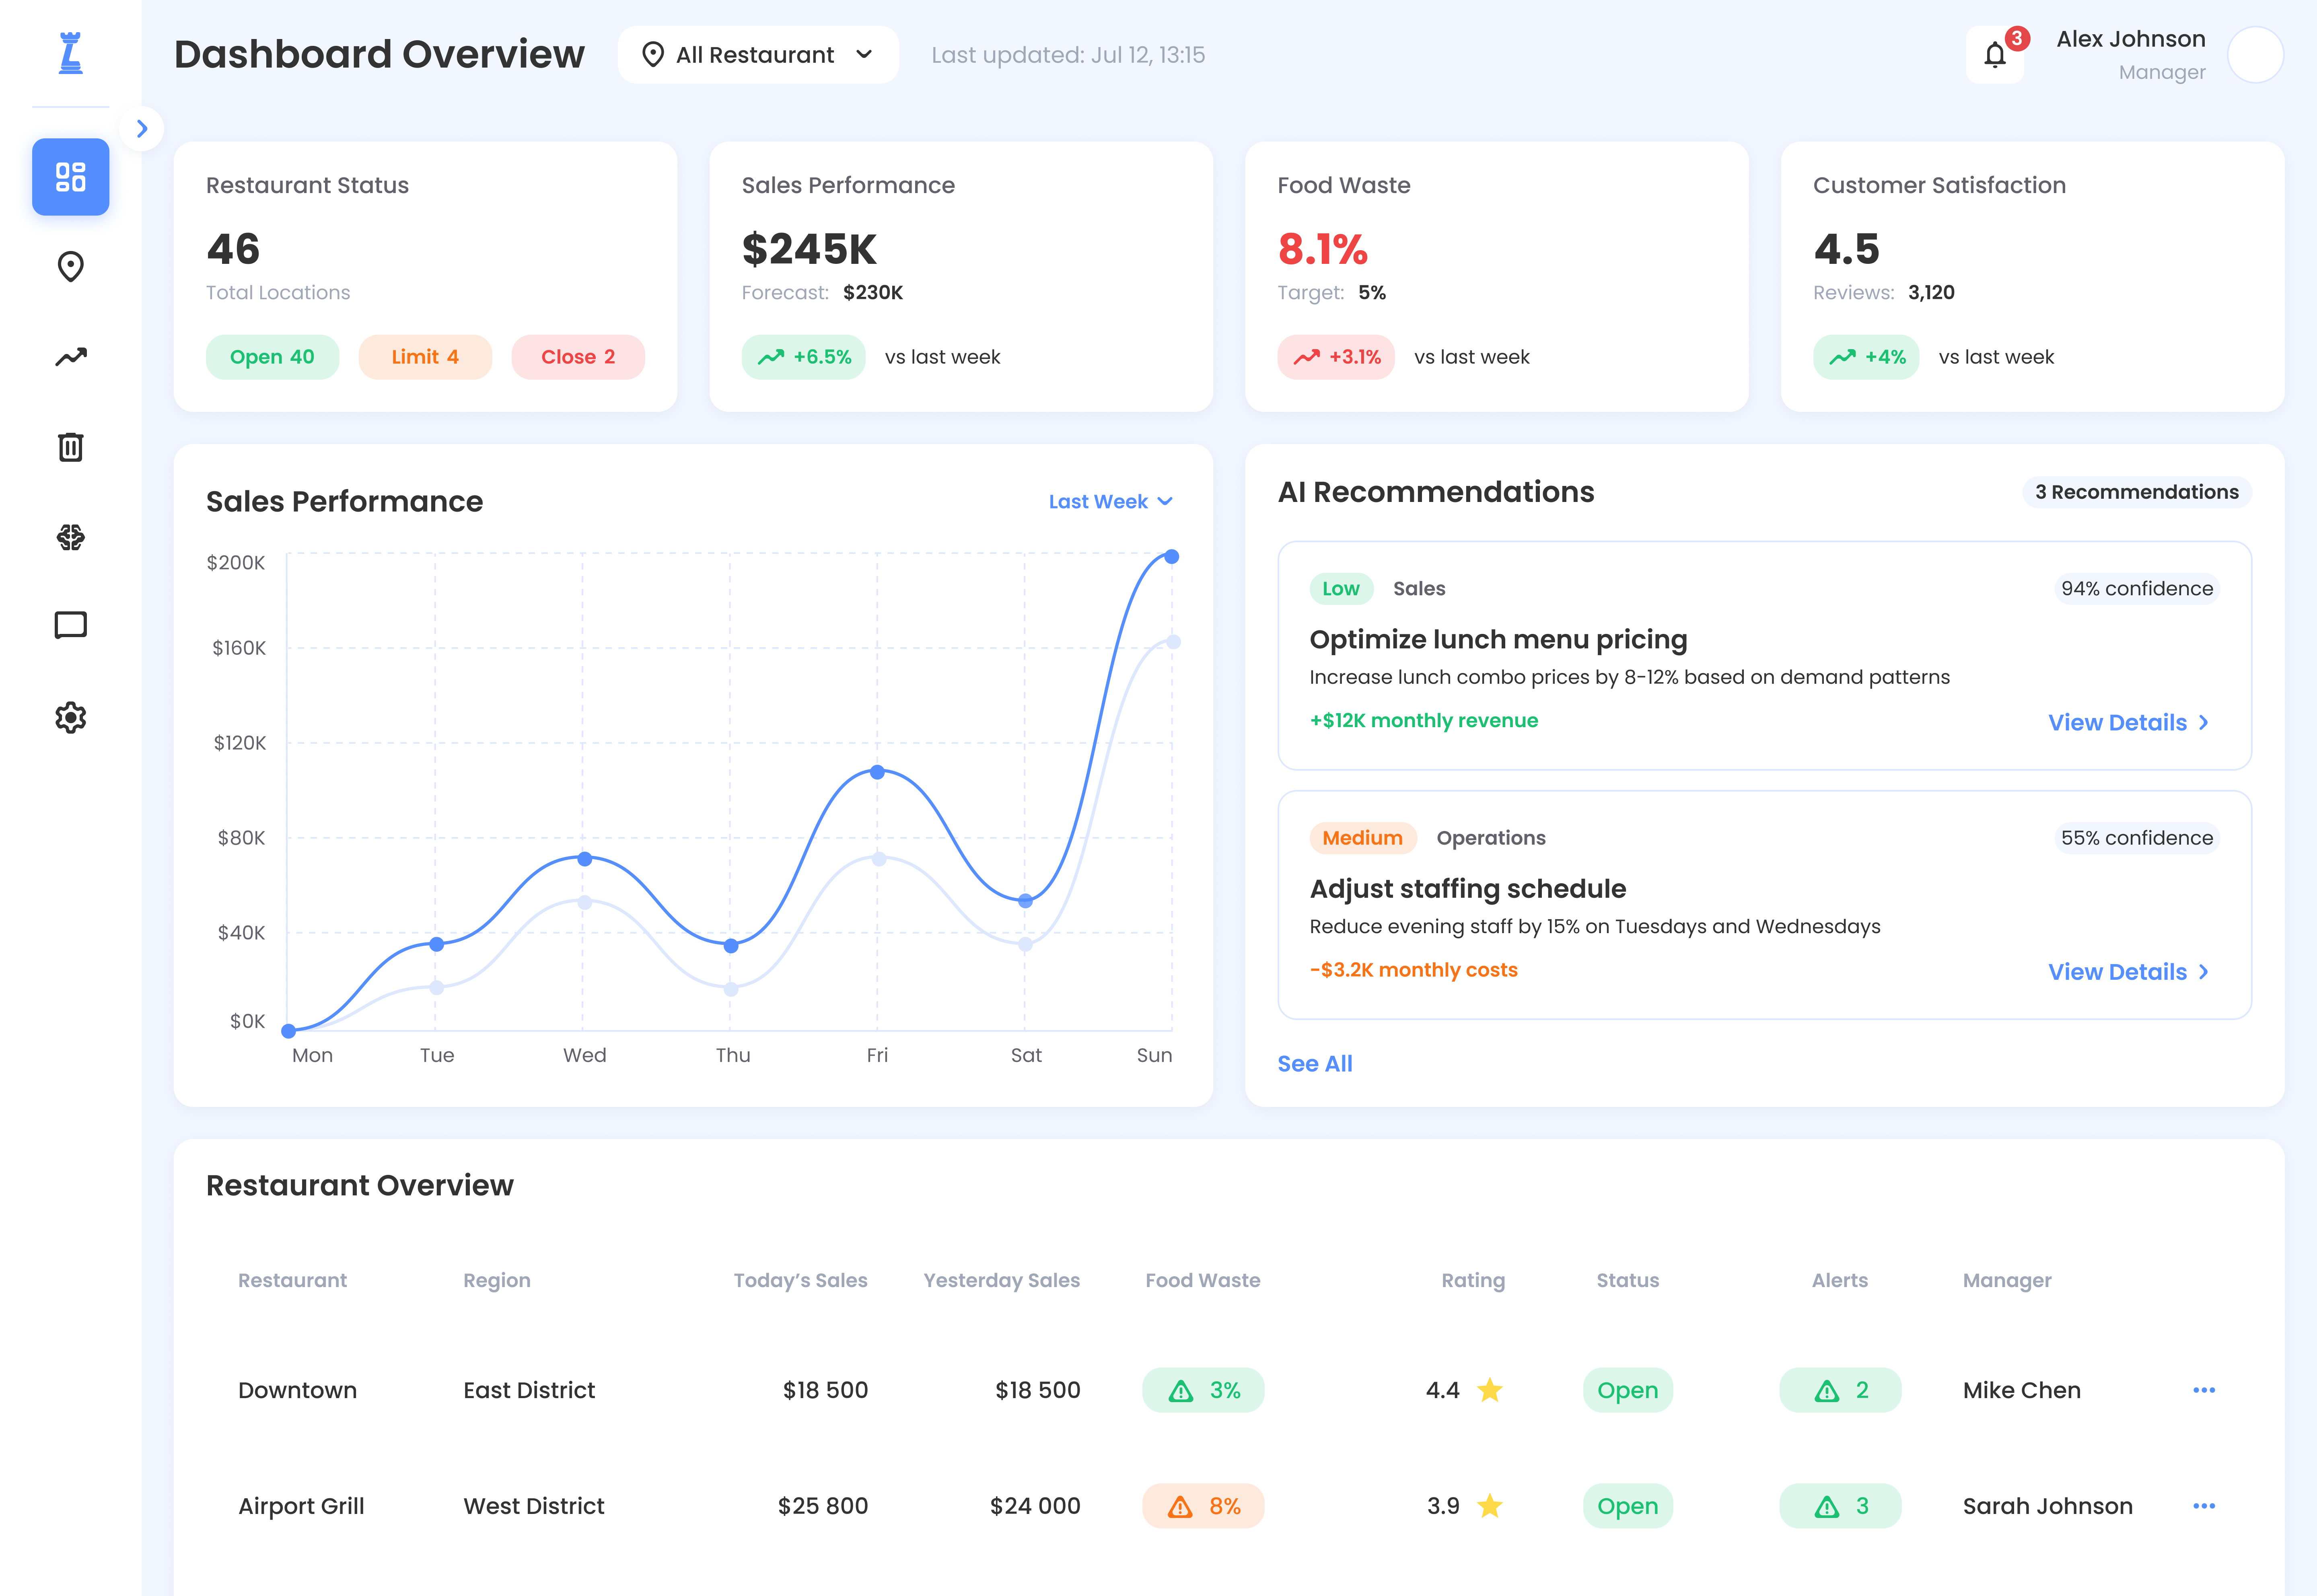
Developed UI/UX design of an analytical dashboard for the restaurant business in Figma. The interface allows convenient monitoring of key performance indicators of the restaurant network in real time. The dashboard contains blocks with analytics, charts, AI recommendations, and a summarized table for each establishment.
Main features of the interface:
Restaurants status: total number of establishments with status indicators (open, restricted, closed)
Sales: current revenue amount, forecast, and dynamics compared to last week
Food waste: waste percentage indicator, target level, and weekly change
Customer satisfaction: average rating, number of reviews, and improvement trend
Sales performance chart: interactive weekly chart
AI recommendations: personalized tips for optimizing prices, staff scheduling, etc., with impact assessment on income/expenses
Summarized table of restaurants: data for each establishment (region, today’s and yesterday’s sales, waste, rating, status, warnings, manager)
Design solution:
Minimalist, clear interface
Bright accents for quick orientation
Responsive layout for various screen sizes
Status and indicator system for quick response
Data visualization for simplified analysis
The project helps optimize operational processes, improve management efficiency of the network, and make informed decisions based on data.