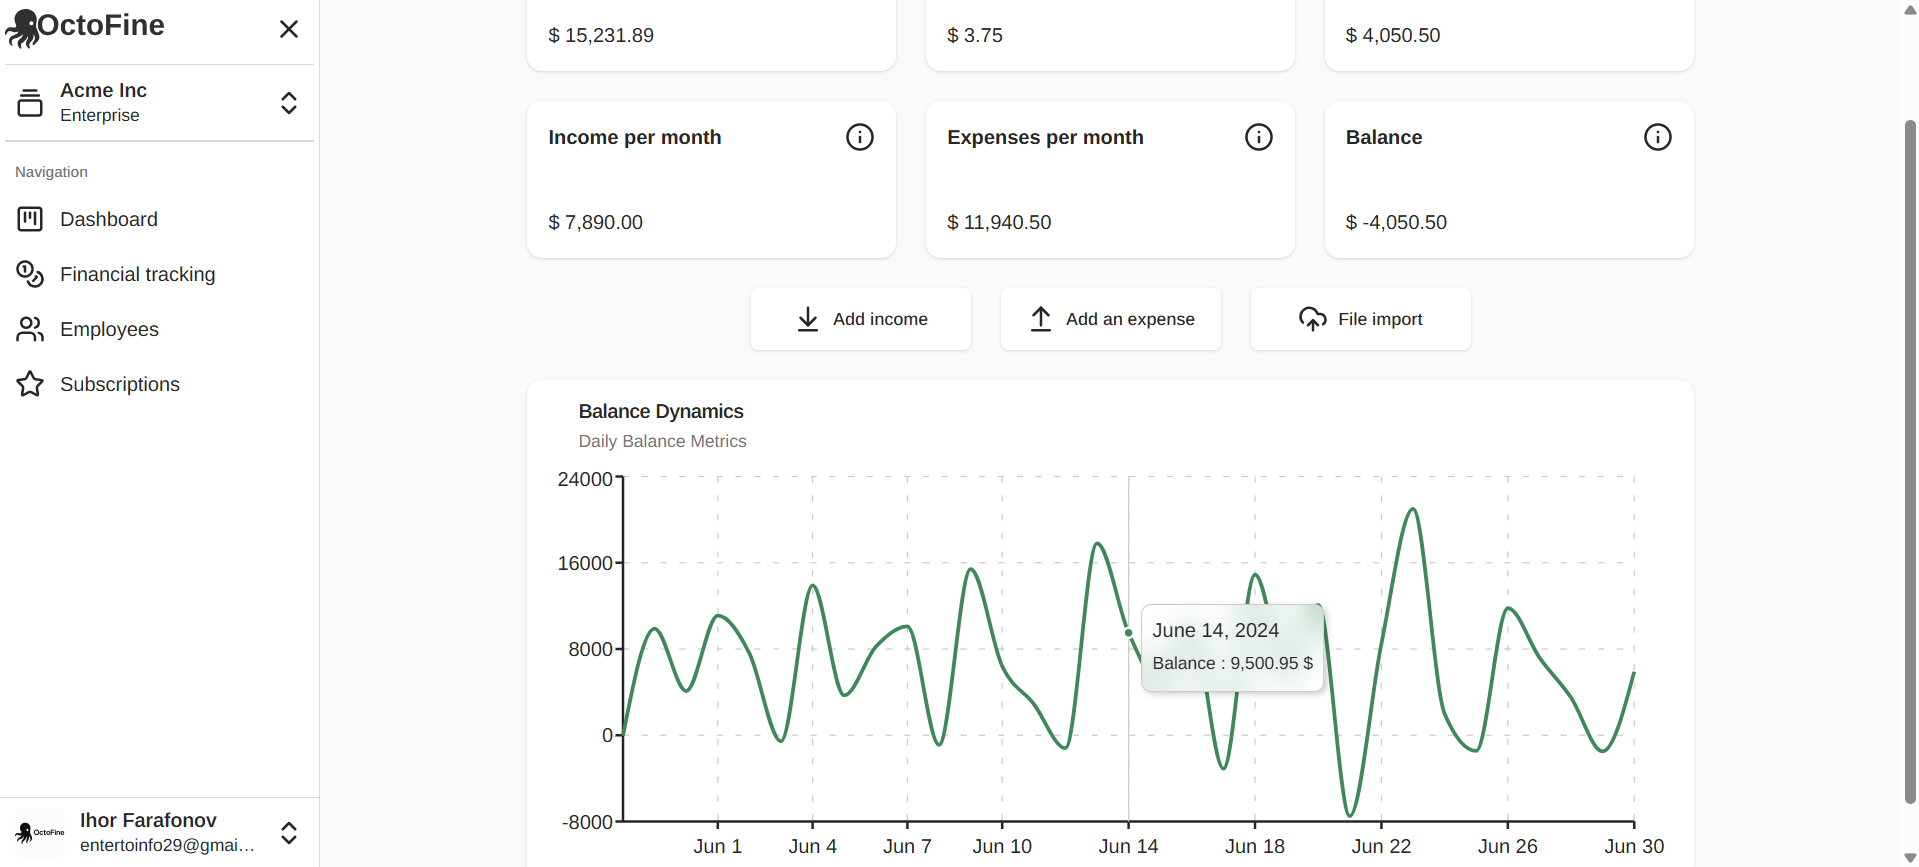
A main analytical dashboard has been developed for the corporate financial monitoring system OctoFine. This interface provides the company's management with a real-time overview of financial health, combining key KPIs and graphical dynamics. Stack: React/Next.js with TypeScript, ensuring high loading speed and stability in displaying numerical data. Implementation of a complex interactive chart "Balance Dynamics," allowing tracking of fluctuations with daily detail using the Recharts library. #React #TypeScript #javascript #Frontend