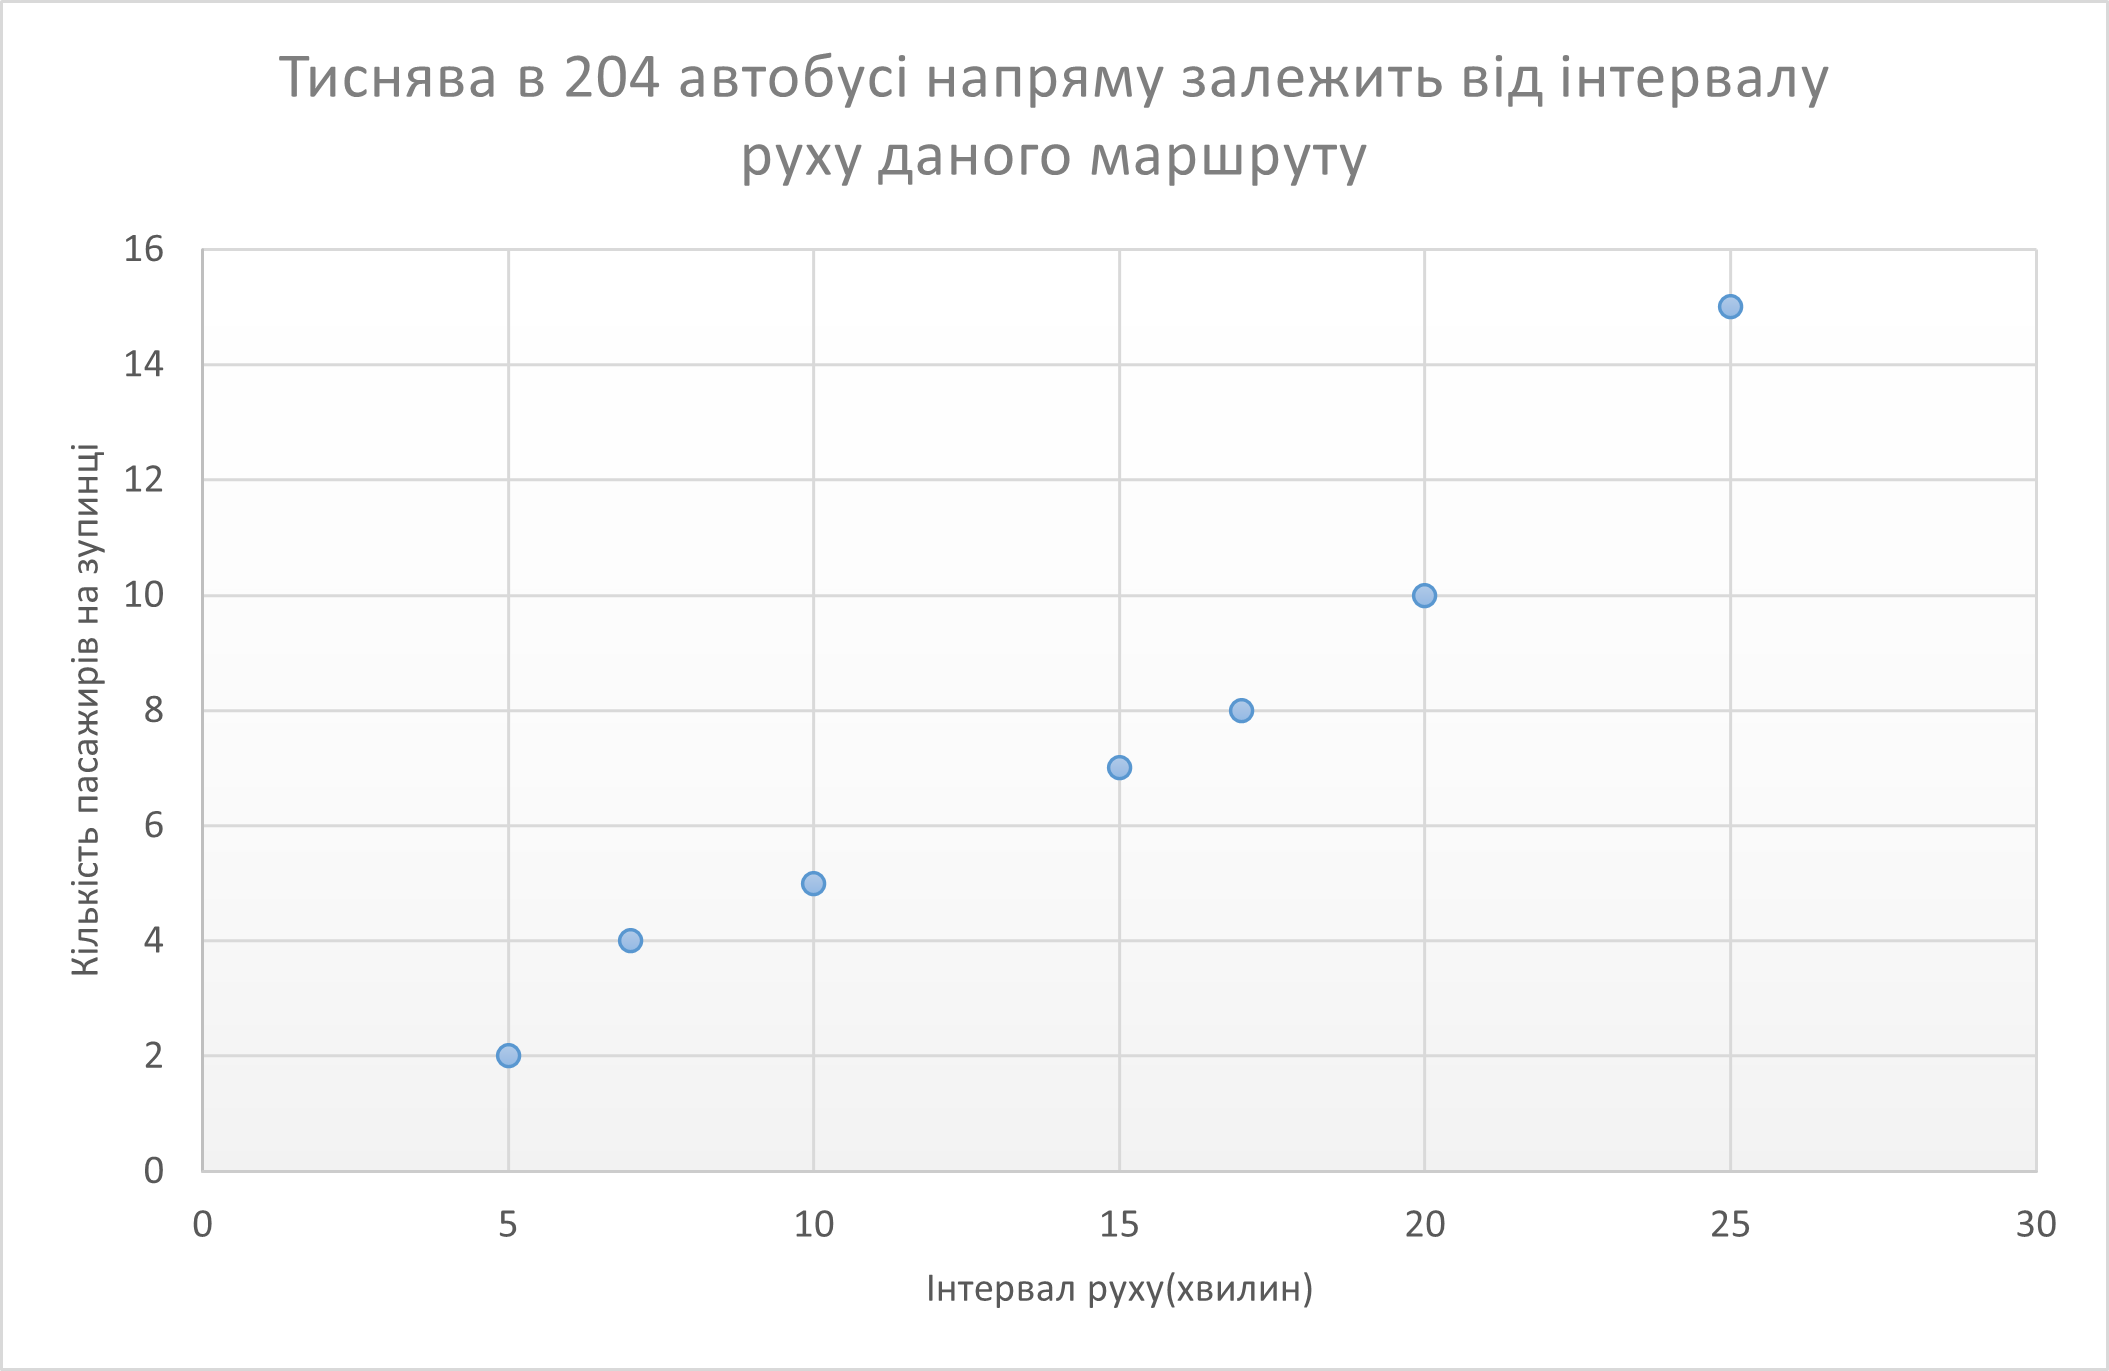
A scatter plot shows the relationship between two indicators through individual points on the graph and is used for data correlation. The title is chosen in such a way that it provides summary information about the data, rather than just naming them: graph, frequency, number of passengers, etc.
#visualization #data_visualization #chart
#visualization #data_visualization #chart