Power BI Dashboard Project | Sales Analysis
Data Processing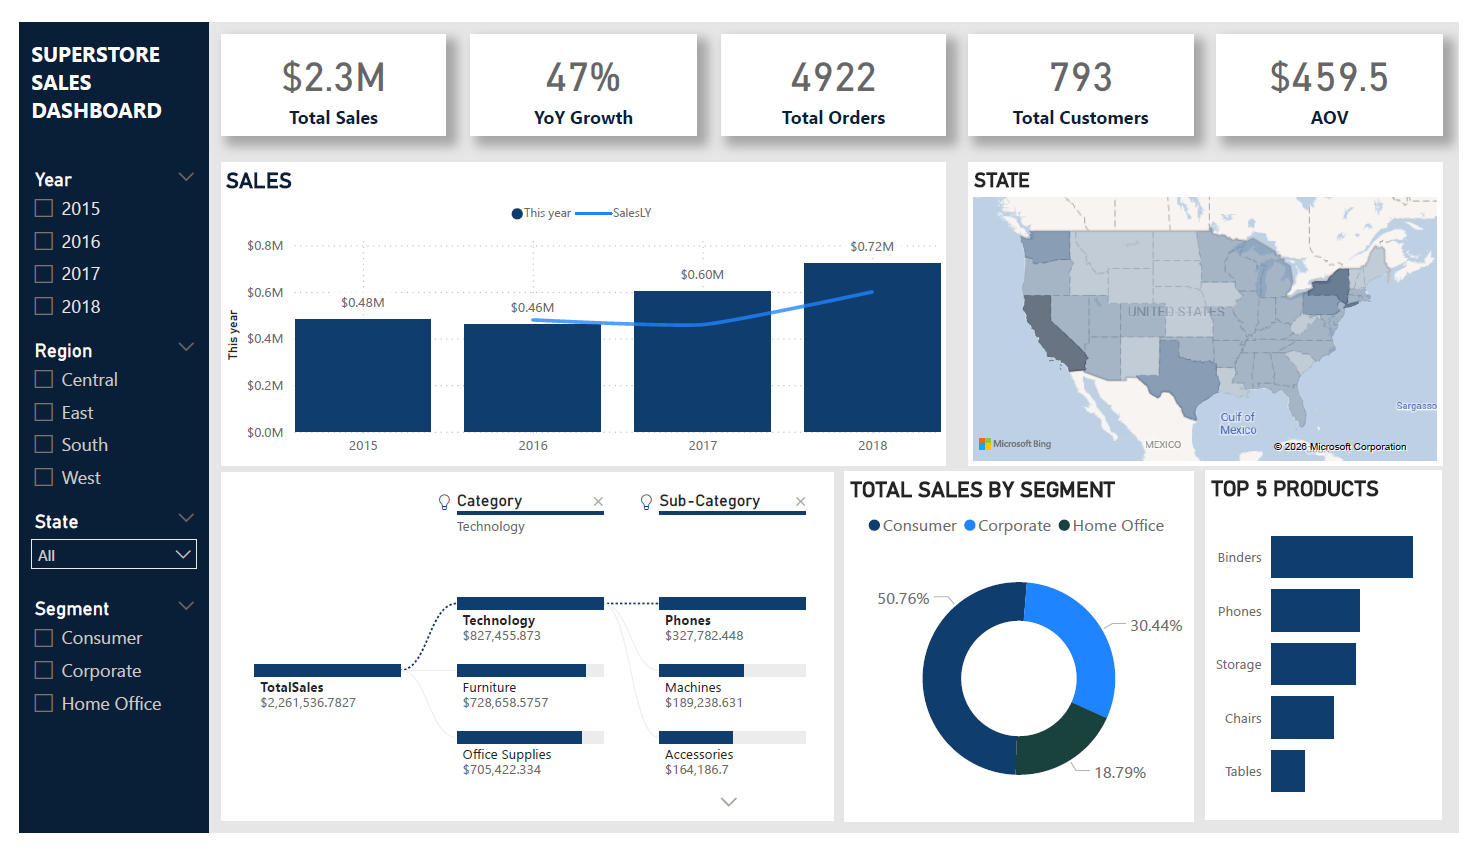
A complete cycle of ETL processes has been performed in Power Query (cleaning, transformation, data type settings). Dynamic metrics have been calculated in DAX (total sales, YoY growth, AOV). An interactive dashboard has been built using Filled Maps for geographical analysis, line charts for tracking trends, etc. The ability to filter for viewing data by different years, for different locations, and different user segments has been added.