PowerBI-Sales-Dashboard-ETL
ETL and cleaning (Power Query): Data from 3 different Excel files has been combined. Missing values (null) have been processed, case in names has been corrected, and a calculated column "Month" has been created to track dynamics.
Data modeling: A relational model has been built using the "Star Schema." A separate product reference has been highlighted, and a "one-to-many" (1:*) relationship has been set up.
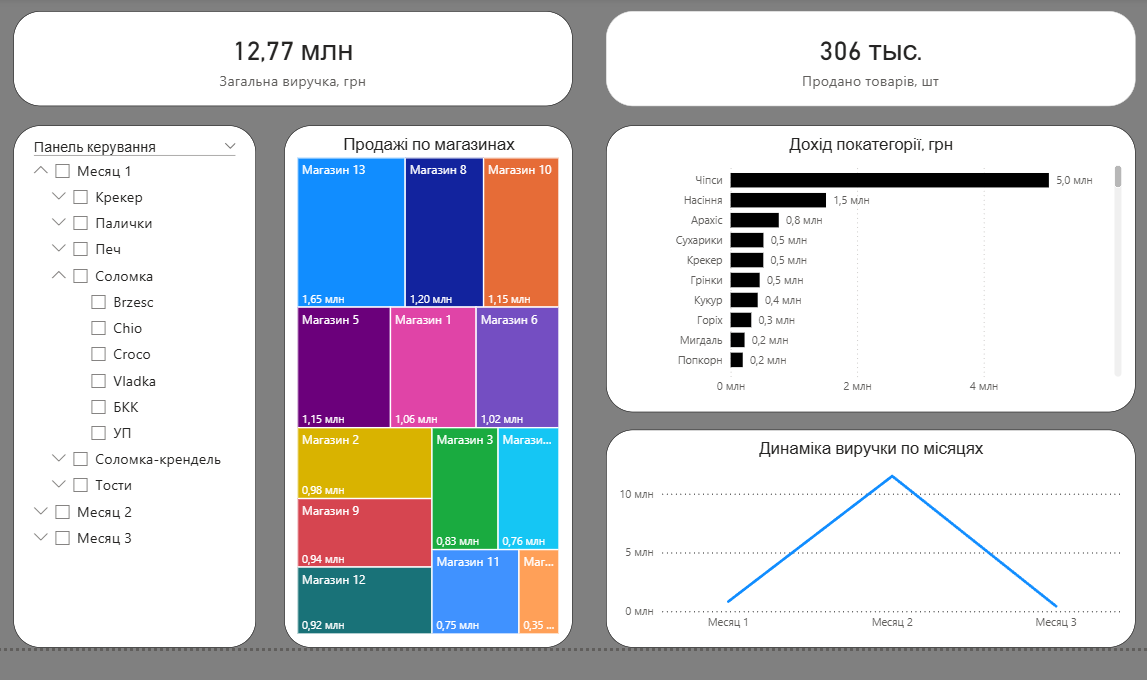
Visualization: A user-friendly Executive Dashboard has been created in a strict style without "visual noise."
Functionality: KPI cards (total amount, quantity), a trend chart, top sales by categories, and interactive filters (slices) for deep analysis have been added.
Data modeling: A relational model has been built using the "Star Schema." A separate product reference has been highlighted, and a "one-to-many" (1:*) relationship has been set up.
Visualization: A user-friendly Executive Dashboard has been created in a strict style without "visual noise."
Functionality: KPI cards (total amount, quantity), a trend chart, top sales by categories, and interactive filters (slices) for deep analysis have been added.
 Odessa