presentation of data analytics work
Databases & SQL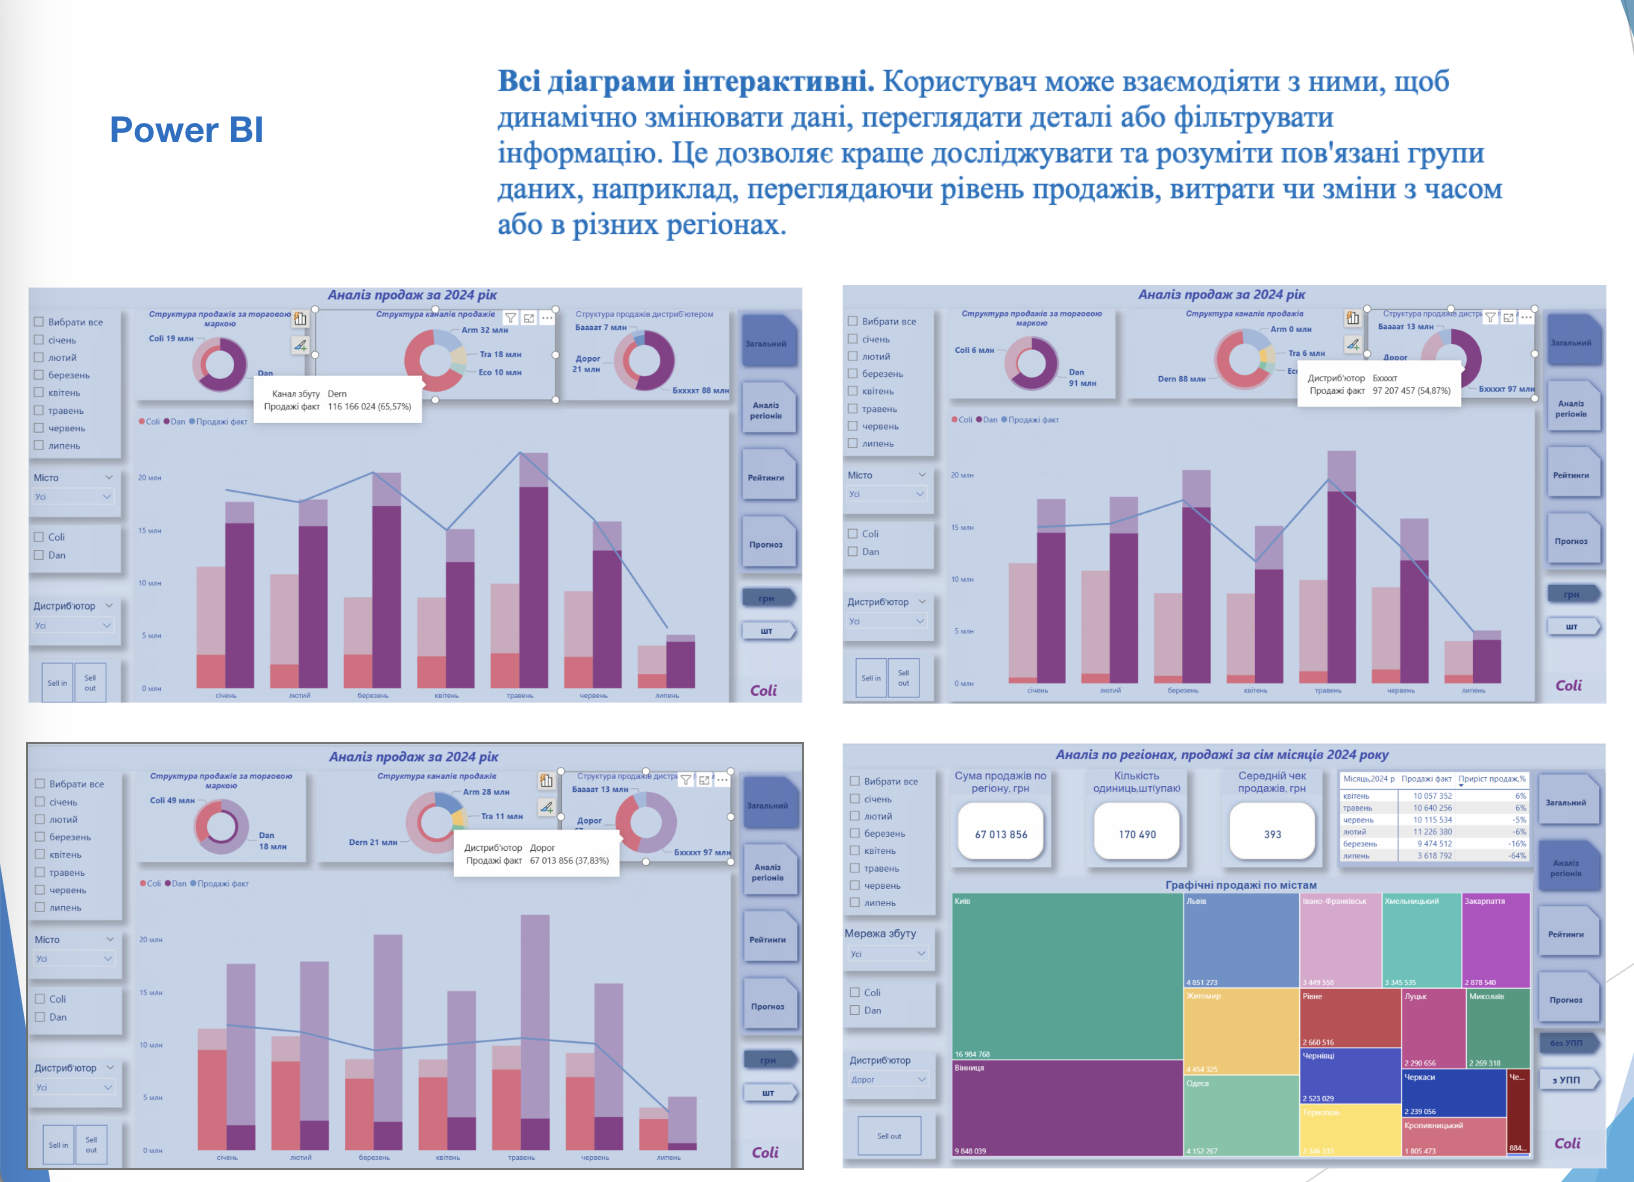
This work is dedicated to data analysis using SQL, Power BI, and Python.
In the first part, various calculations related to salaries, department structures, and employees are conducted using SQL queries. Different methods of filtering and grouping data are shown, as well as comparisons of query results.
In the second part, an analytical project in Power BI is presented, which uses data from a manufacturing and trading enterprise for the period of January to July 2024. The main goal is to analyze product sales, compare results by regions, distributors, brands, and sales channels, determine the rankings of retail points, and create a sales forecast.
In the third part, an analysis of the IKEA product dataset was conducted using Python. The data was cleaned and prepared for analysis. A comparison of the median prices of products sold online and those not sold online was made, and corresponding visualizations were created, among other things. The best model for predicting furniture prices was also determined.