The client needed to automate sales reporting. Data came in the form of disparate CSV and Excel files from CRM and advertising accounts. Manual processing took 3-4 hours each week.
Solution:
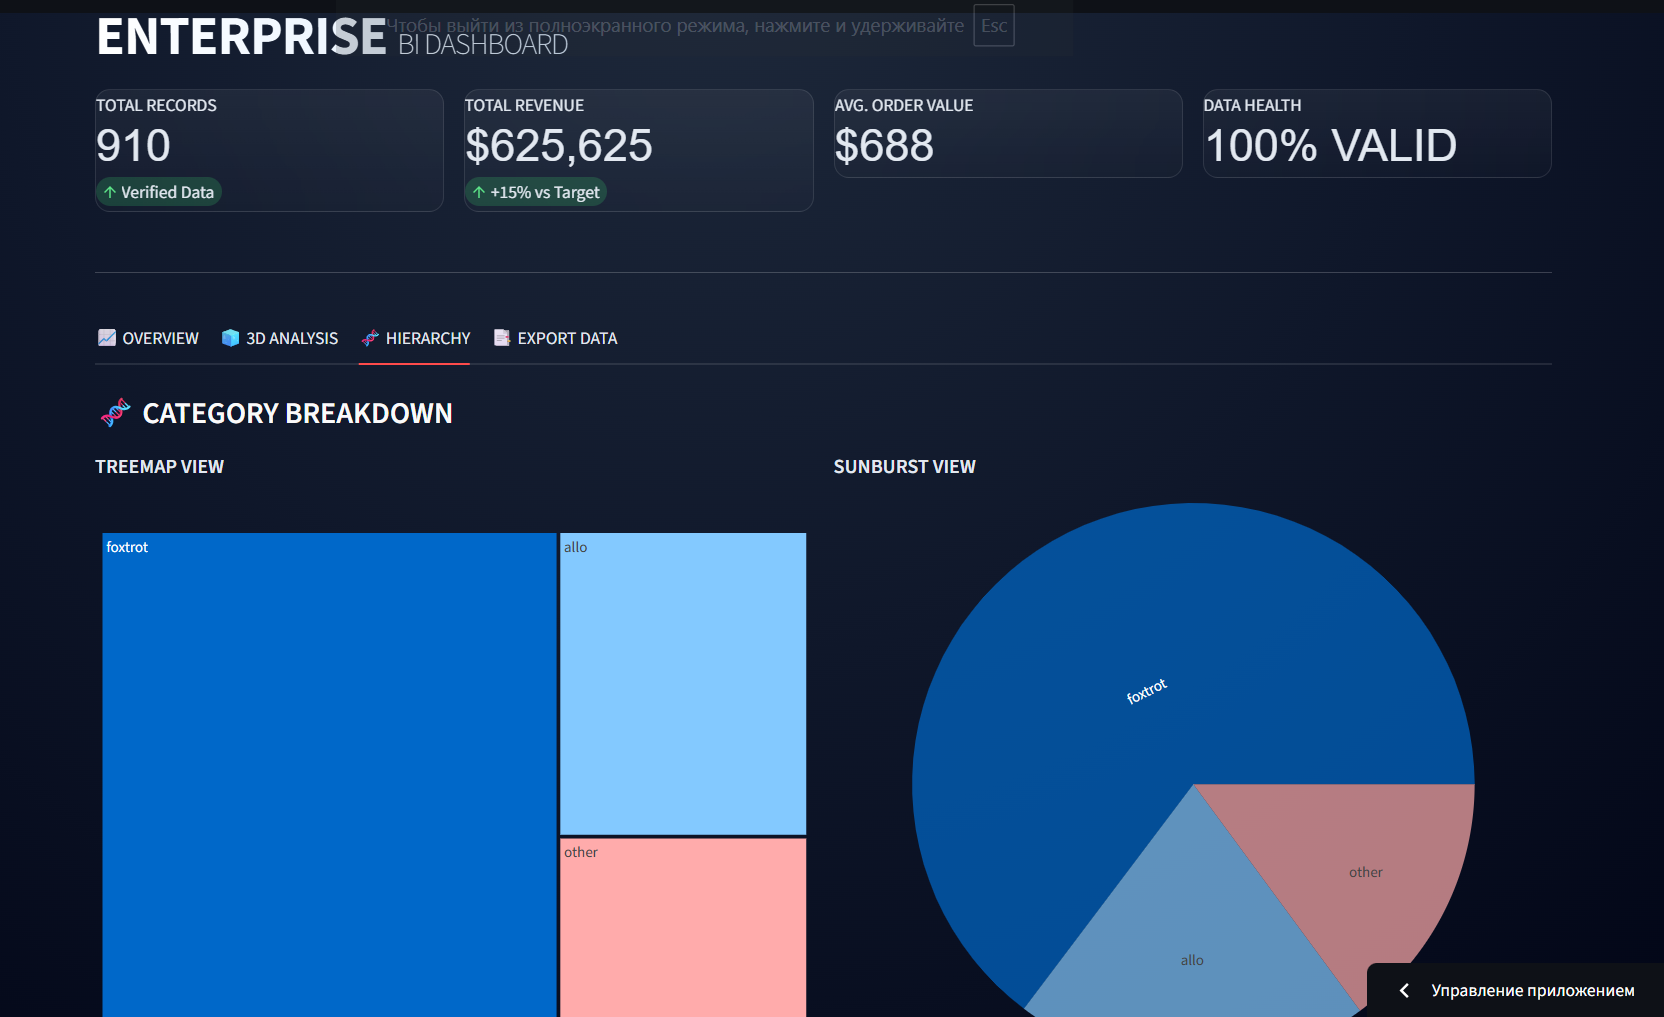
A custom web application (Dashboard) was developed based on Python.
What was done:
Data Cleaning: A script was written for automatic merging and cleaning of data.
Visualization: Interactive charts were built that allow filtering of sales by date, region, and product category.
Interface: A user-friendly Dark Mode interface was implemented.
Result:
The client uploads files to the system and receives a ready financial report in 10 seconds. Time savings — 15 hours per month.
#Python #Pandas #Streamlit #Plotly #ExcelAutomation #Dashboard #DataAnalysis #Automation
Solution:
A custom web application (Dashboard) was developed based on Python.
What was done:
Data Cleaning: A script was written for automatic merging and cleaning of data.
Visualization: Interactive charts were built that allow filtering of sales by date, region, and product category.
Interface: A user-friendly Dark Mode interface was implemented.
Result:
The client uploads files to the system and receives a ready financial report in 10 seconds. Time savings — 15 hours per month.
#Python #Pandas #Streamlit #Plotly #ExcelAutomation #Dashboard #DataAnalysis #Automation