Restaurant Analytics Dashboard
Web Programming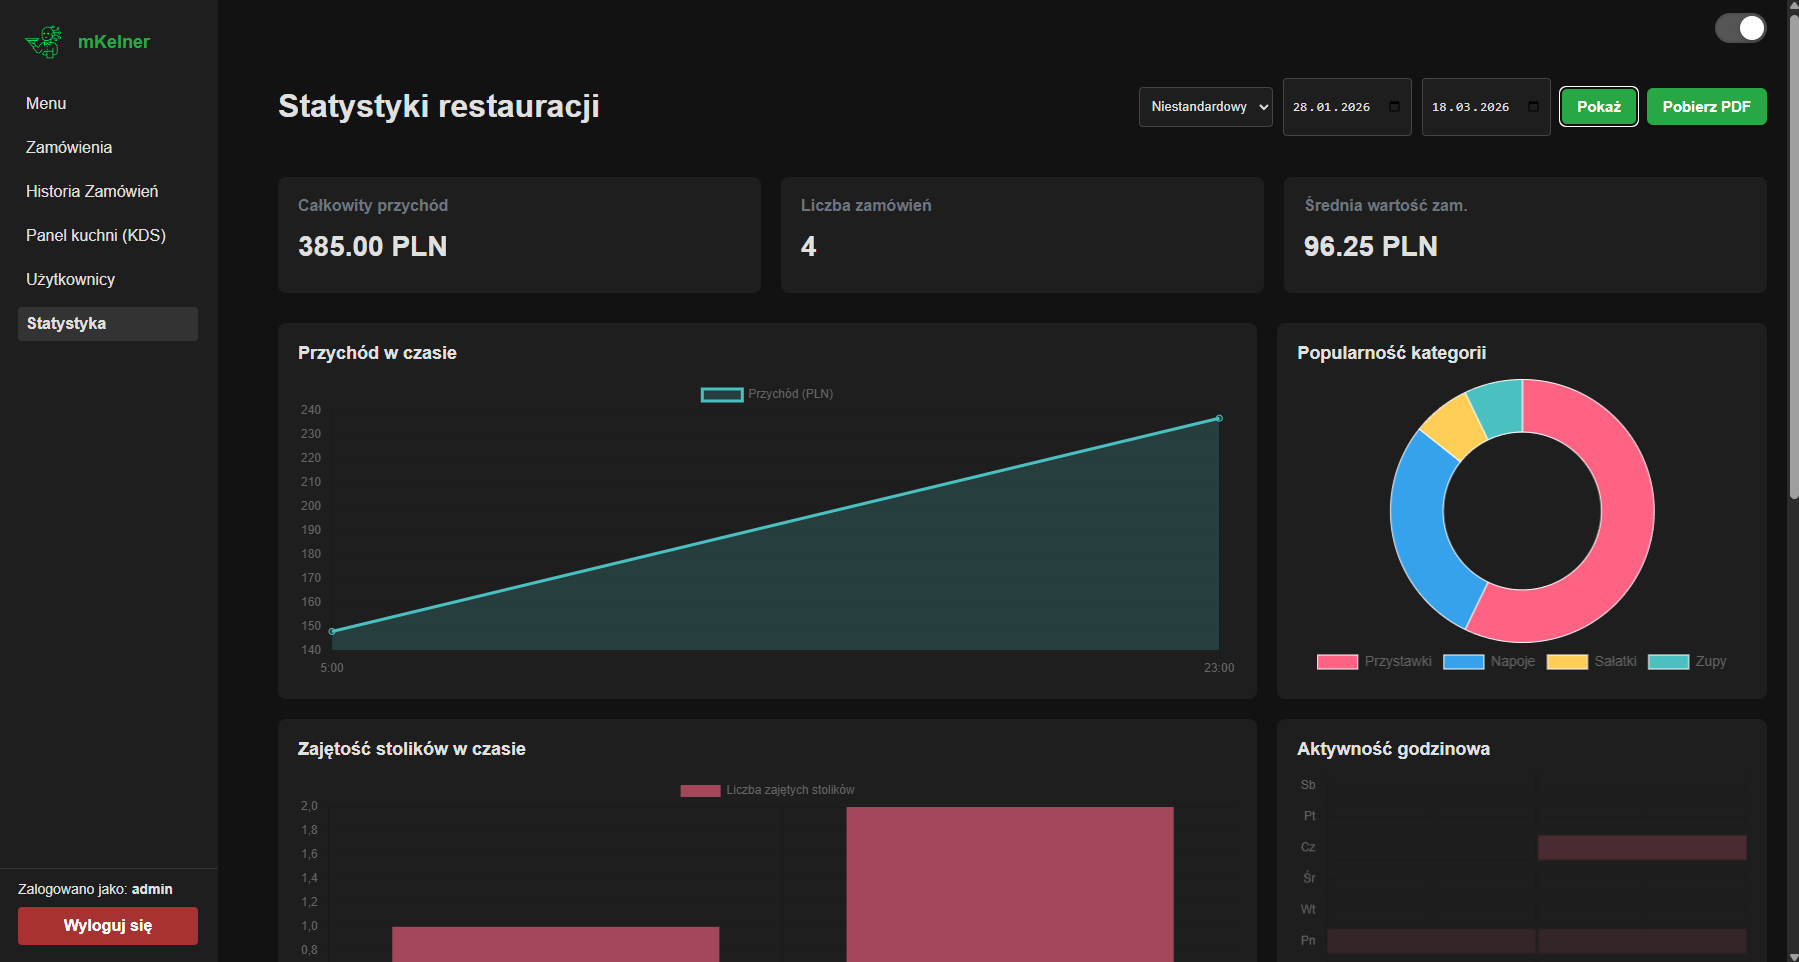
Development of an information dashboard for visualizing key restaurant performance indicators. The interface is designed for quick monitoring of the establishment's situation in real-time. Key sections include:
Revenue Chart: A line graph showing income dynamics during the working day (from 5:00 AM to 11:00 PM).
Key Performance Indicators (KPIs): Widgets displaying total order count (4), average check value (96.25 PLN), and custom reports.
Category Analytics: Visualization of dish category popularity (appetizers, drinks, salads, soups) to understand demand.
Custom Reports: Functionality for selecting data by period (01/28/2026 - 03/18/2026) with the option to export to PDF.
Additional Graphs: Display of table occupancy and hourly/daily activity for optimal resource planning.