Task:
For one of the projects, it was necessary to deploy a monitoring stack. The client required monitoring of services and a notification system based on Nagios. Additionally, Prometheus and Grafana were needed to track SLO/SLI and individual services.
How I implemented it:
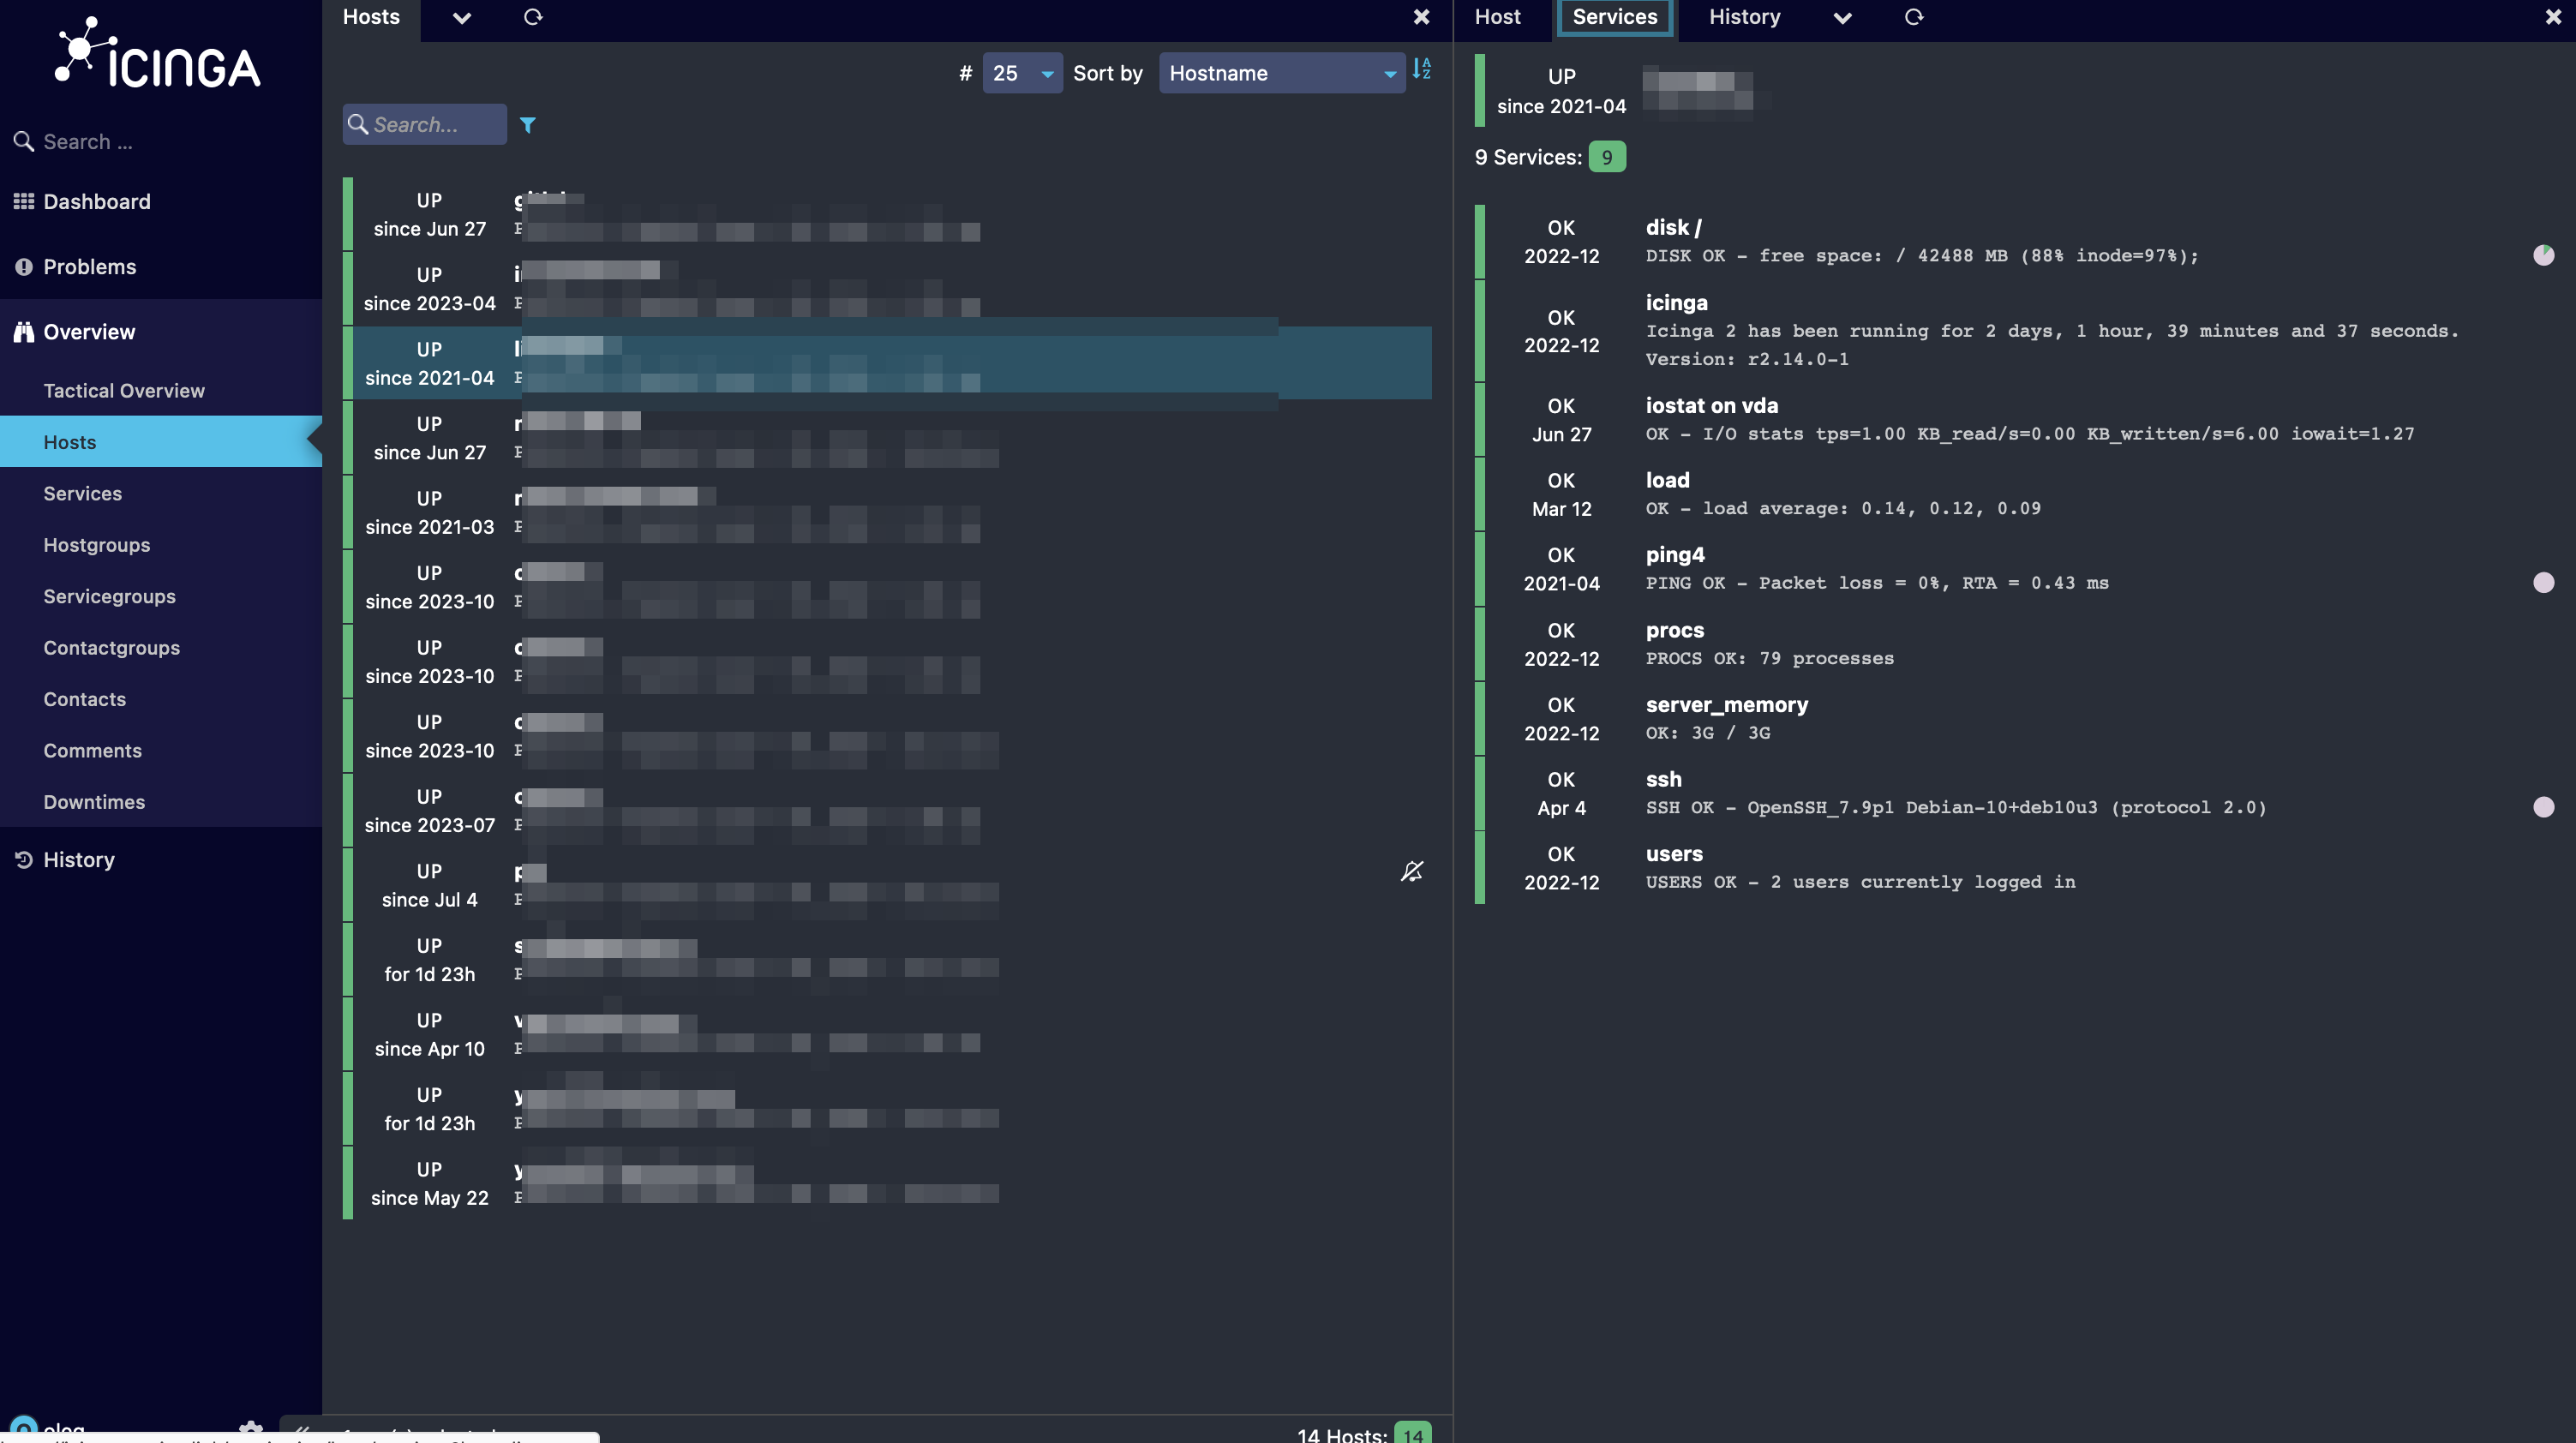
Instead of Nagios, I recommended using Icinga due to its more powerful API and user-friendly dashboard. Furthermore, Icinga is better suited for scaling and implementing high availability. The Icinga server was initially configured with scalability in mind. I grouped all services and set up detailed metrics and notifications for the staff.
To collect extended metrics for individual services, Prometheus was used. VictoriaMetrics was employed as the metrics storage due to its high performance and extensive scaling capabilities. A distributed cluster of VictoriaMetrics was deployed for the client.
SLI and alerts for SLO violations were configured for critical services. Grafana was used for convenient visualization of graphs.
#grafana #prometheus #icinga2
For one of the projects, it was necessary to deploy a monitoring stack. The client required monitoring of services and a notification system based on Nagios. Additionally, Prometheus and Grafana were needed to track SLO/SLI and individual services.
How I implemented it:
Instead of Nagios, I recommended using Icinga due to its more powerful API and user-friendly dashboard. Furthermore, Icinga is better suited for scaling and implementing high availability. The Icinga server was initially configured with scalability in mind. I grouped all services and set up detailed metrics and notifications for the staff.
To collect extended metrics for individual services, Prometheus was used. VictoriaMetrics was employed as the metrics storage due to its high performance and extensive scaling capabilities. A distributed cluster of VictoriaMetrics was deployed for the client.
SLI and alerts for SLO violations were configured for critical services. Grafana was used for convenient visualization of graphs.
#grafana #prometheus #icinga2