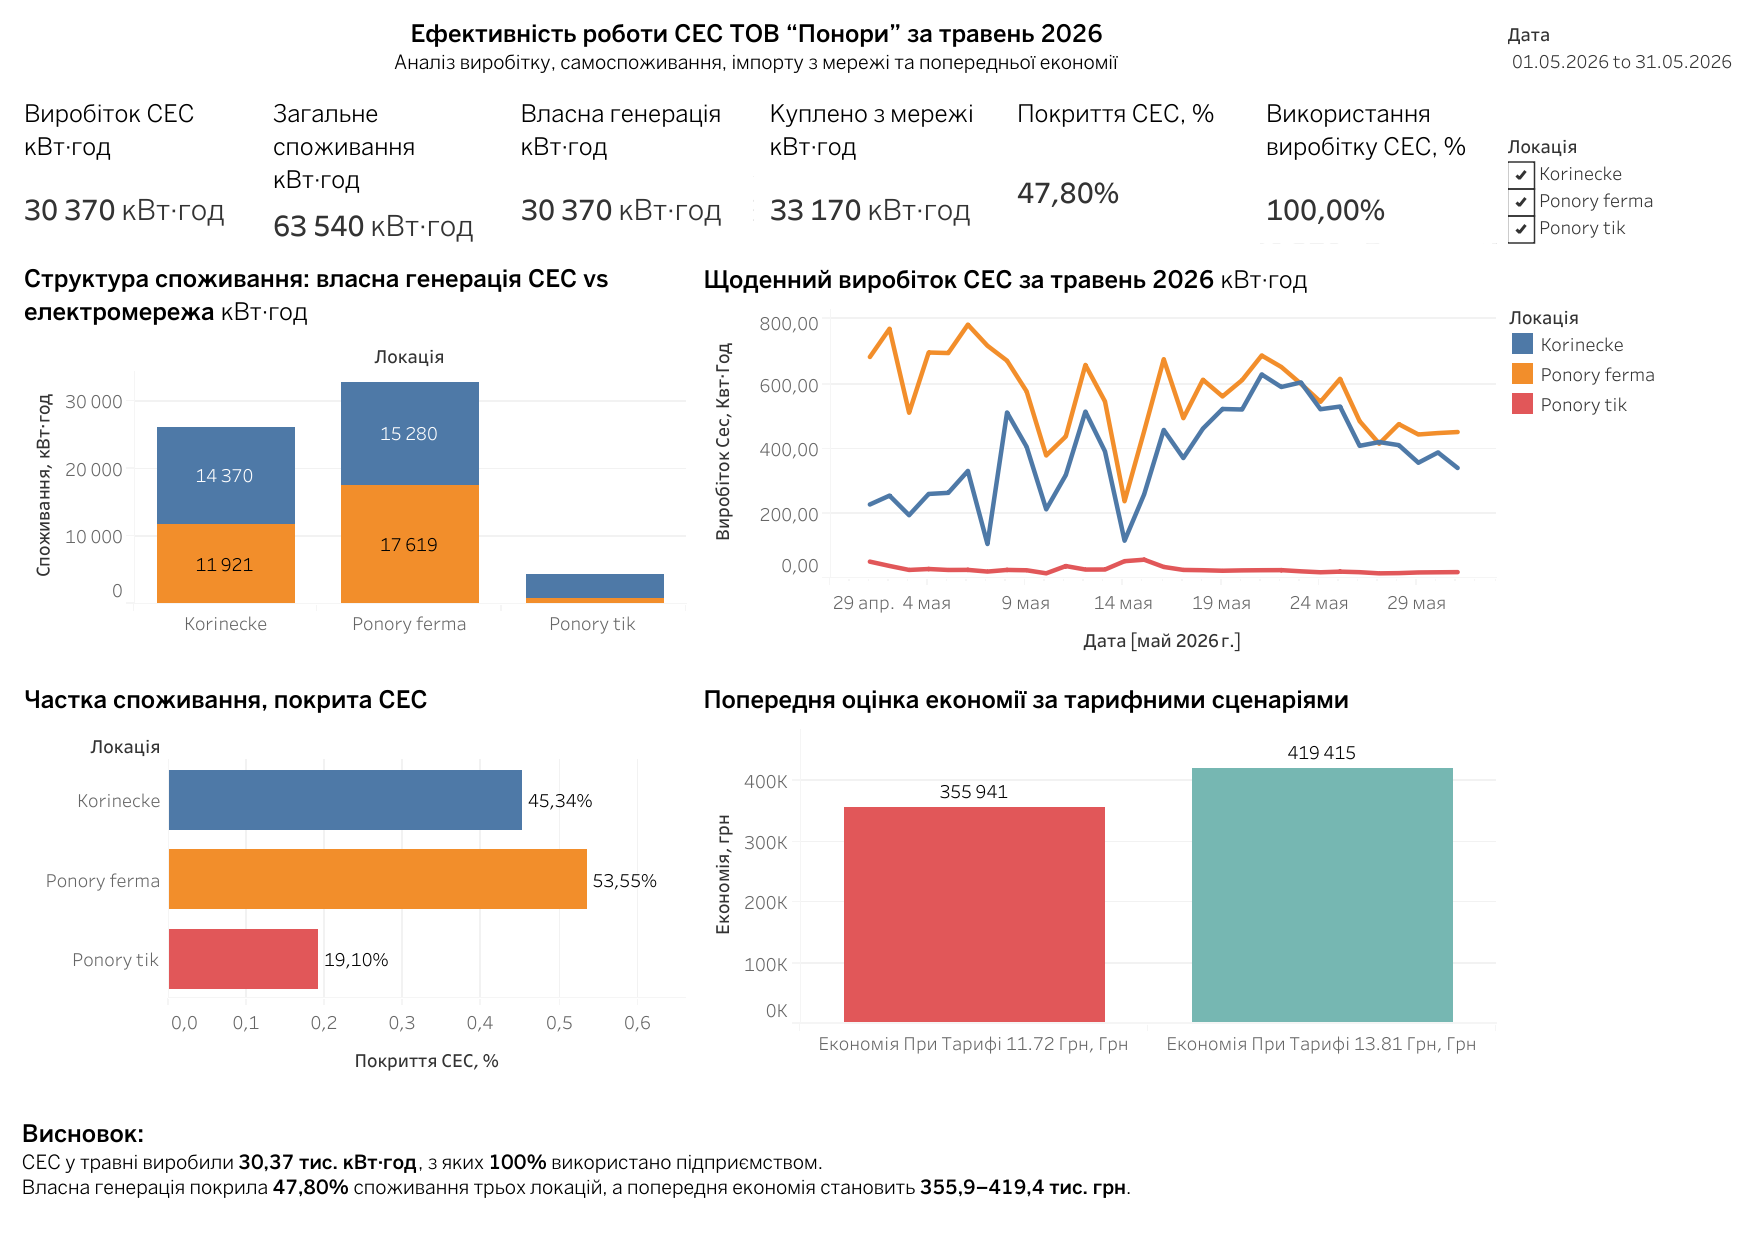
Interactive Tableau dashboard for monitoring solar power plant (SPP) performance and evaluating its impact on electricity consumption and operational efficiency.
Helps understand how much of the company's energy demand is covered by solar generation and provides insights into energy consumption patterns across different locations.
The dashboard includes key operational and energy metrics such as:
Solar Power Generation (kWh)
Electricity Consumption (kWh)
Self-consumption vs Grid Consumption
Solar Coverage Rate
Daily and Monthly Generation Dynamics
Energy Consumption by Location
Estimated Cost Savings from Solar Generation
Comparative Analysis of Energy Usage Before and After SPP Implementation
The dashboard helps quickly assess SPP performance and supports operational and management decision-making related to energy efficiency and cost optimization.
Data source: Solar monitoring system, electricity consumption records, utility invoices
Data preparation: Excel, Python (Pandas)
Visualization: Tableau Public
#tableau #dashboard #dataanalysis #datavisualization #businessanalytics #excel #sql #python #pandas #energyanalytics