Superstore Sales Dashboard
Data Processing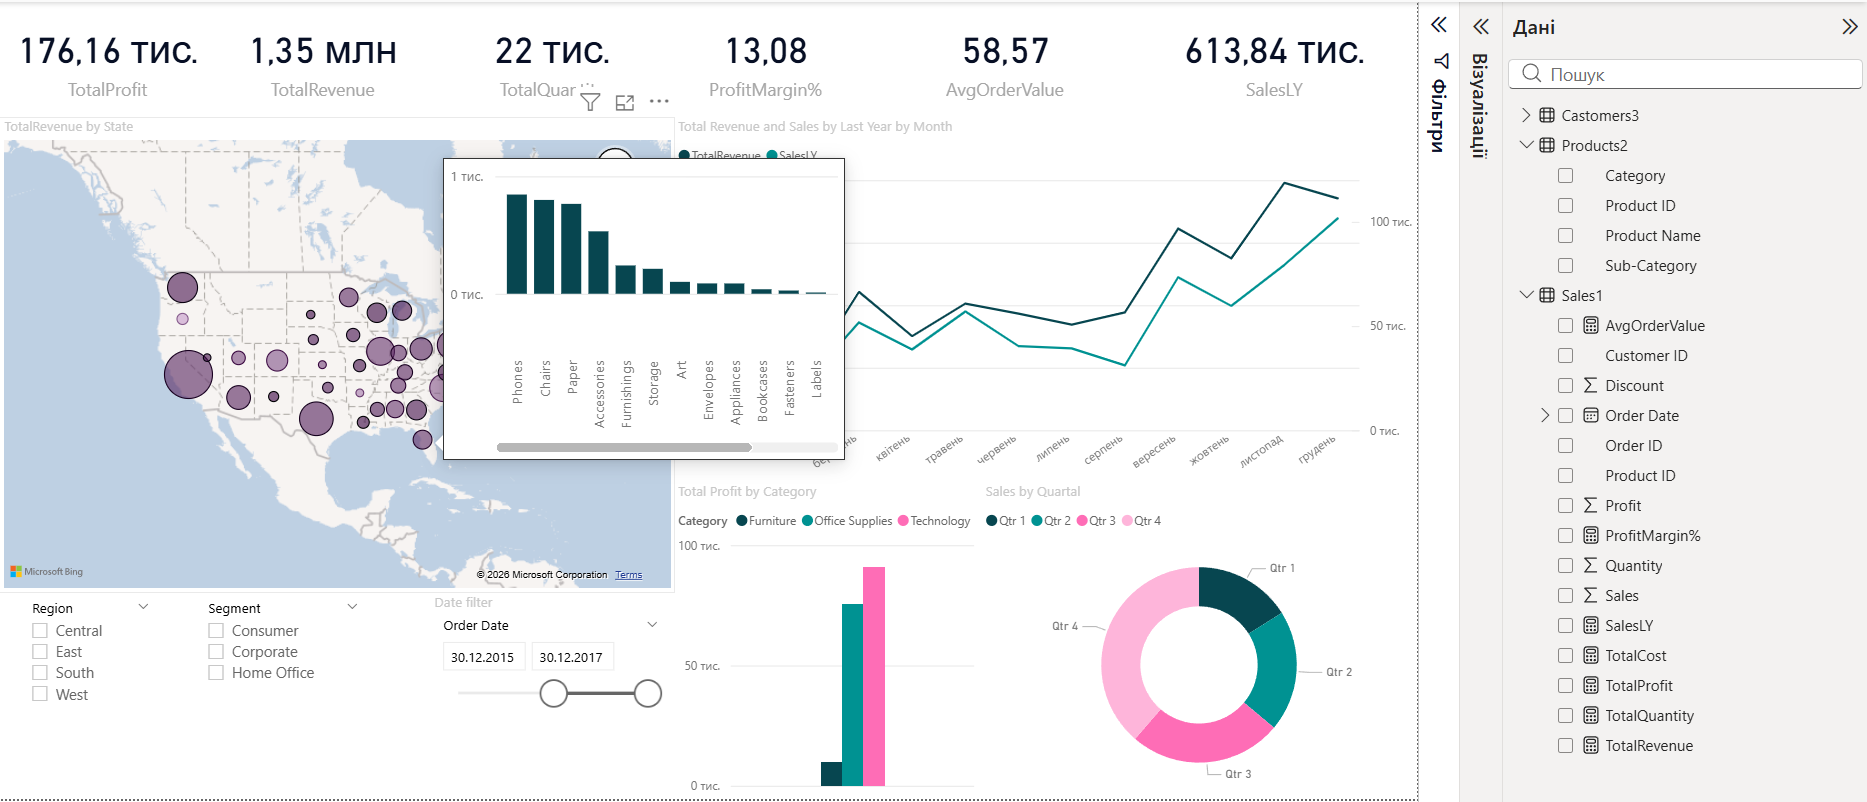
Interactive dashboard for monitoring retail sales performance
Data modeling: Converting a "flat" sales table (Superstore #dataset) into a relational model using the "Star" schema (Star Schema), highlighting individual product directories and customers.
#DAX calculations: Developed a system of business #econometrics (Measures ), including:
#KPI : Total Revenue, Profit Margin %, Average Order Value.
Time Intelligence: Comparing sales of the current period with the previous year.
#visualisation : Created an interactive #DashBoards using cartograms, line graphs, and doughnut #charts . Report Page Tooltips were also used to deeply detail #Statistics for each region without overloading the main screen. A Color Blind Friendly color scheme was used for the dashboard, for better perception of information.
Result: A management tool was created that allows instantly assess profitability by category and region in real time.
#PowerBI #Tableau #PowerQuery #DAX #etl