Tripillia: visualization of sociological data
Print Design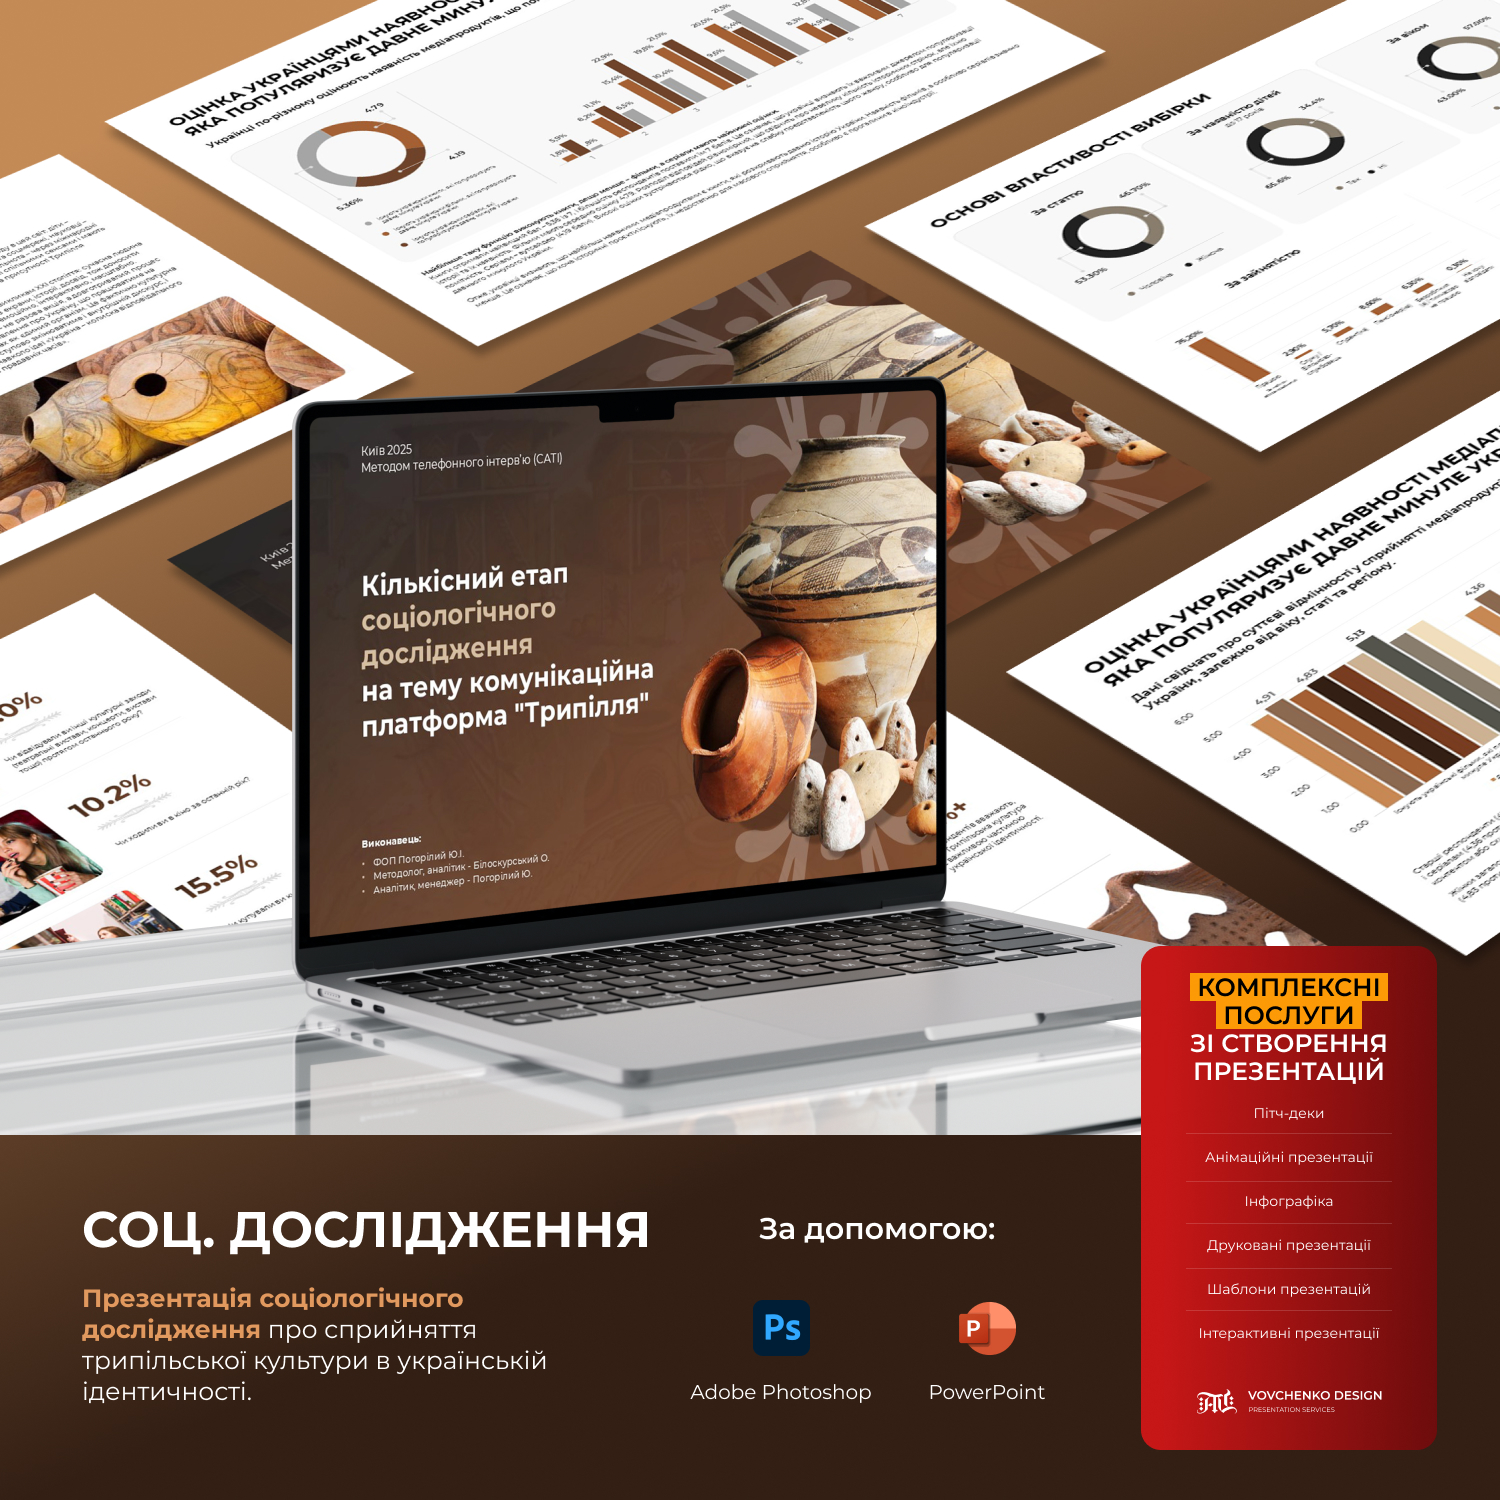
My goal was to make complex analytical material understandable and visually structured. I designed over 60 slides with research results: statistics, charts, conclusions, and graphic elements that help perceive data easily and coherently.
The main focus is on design cleanliness, readability, and logical structure. I worked on the structure, table formatting, typography, and color accents to ensure the presentation looks modern while maintaining academic accuracy.
#presentationdevelopment #presentationdesign #infographics #datavisualization #sociologicalresearch #PowerPointpresentation #slidesdesign #analyticaldesign