Visualization (test task)
Infographics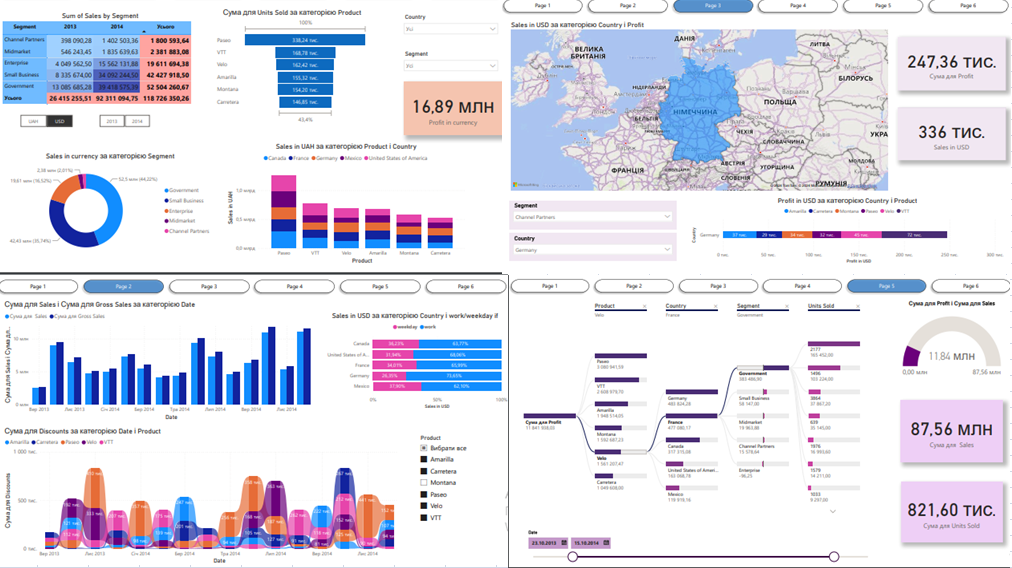
The visualization displays:
- sales table by segments (with filtering by currencies)
- quantity of sold units by categories
- sales amounts by categories and countries with filtering
- analysis of discount amounts by product categories
- sales amounts on working/non-working days
- histogram comparing actual sales and gross sales volume
and many others
I recommend reviewing the link to the full project (interactive)
https://app.powerbi.com/view?r=eyJrIjoiZTlmMjAwNWQtMzE5Yy00ZGVkLTllN2ItMThiNTIxMWEwNTUxIiwidCI6ImE0ZTM1OTNjLTc4OWEtNDhmMS04ZjVkLWZiZGVhNDMwOTdkYyIsImMiOjl9