Interactive Tableau dashboard for comparative analysis of grid electricity consumption before and after solar power plant implementation.
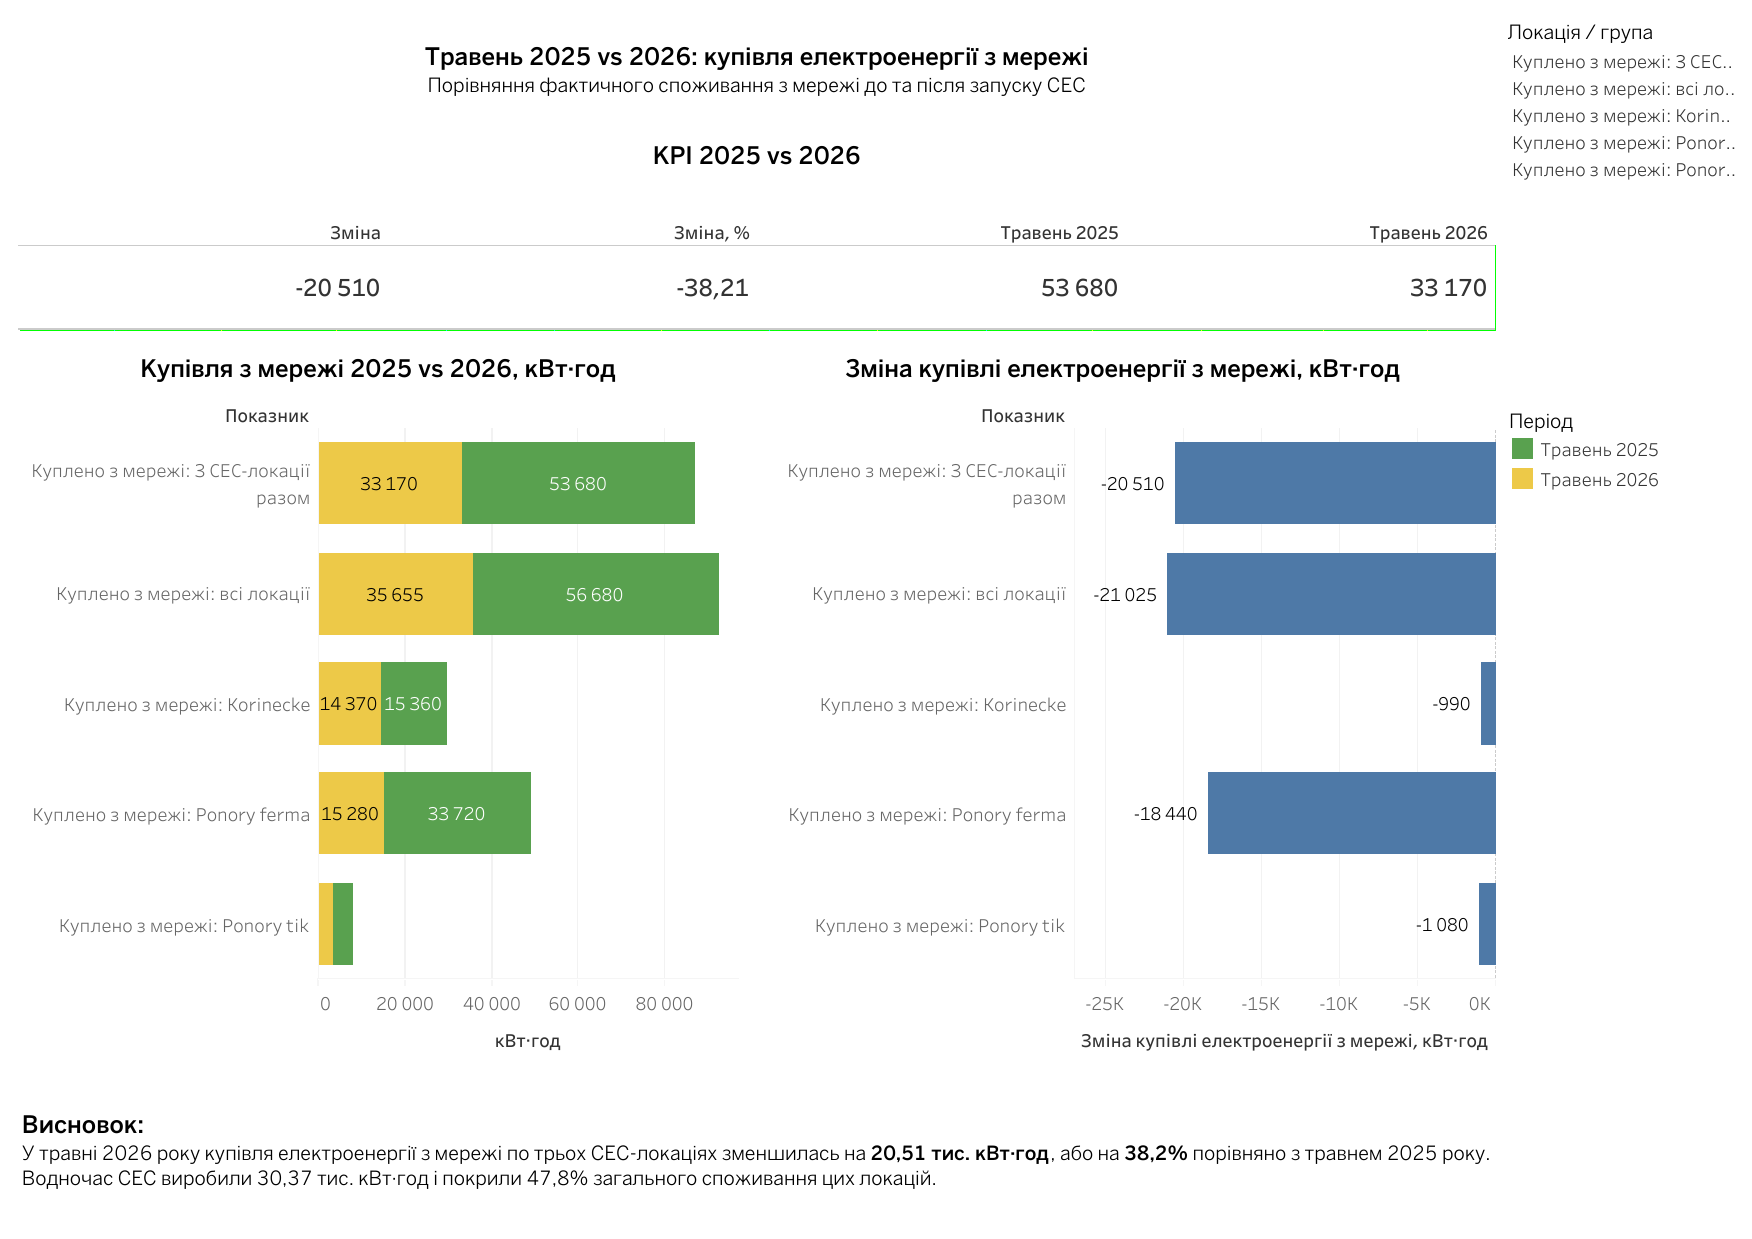
Helps evaluate the impact of solar power plant (SPP) deployment on enterprise energy efficiency by comparing electricity purchased from the grid across different locations and reporting periods.
The dashboard includes key operational and analytical metrics such as:
Grid Electricity Consumption by Location
Comparative Analysis: May 2025 vs May 2026
Absolute and Percentage Change in Grid Electricity Usage
Solar Power Generation Impact Assessment
Solar Coverage Rate
Estimated Reduction in Grid Electricity Purchase
Consolidated KPI Indicators for SPP Locations
The dashboard helps assess the effectiveness of renewable energy implementation, identify energy consumption patterns, and supports data-driven decisions for operational planning and energy cost optimization.
Data sources: Solar monitoring system, electricity meter readings, utility invoices, internal operational records
Data preparation: Excel, Python (Pandas)
Visualization: Tableau Public
#tableau #dashboard #dataanalysis #datavisualization #businessanalytics #excel #sql #python #pandas #energyanalytics