Sales Performance Project
Sales Dashboard in Tableau
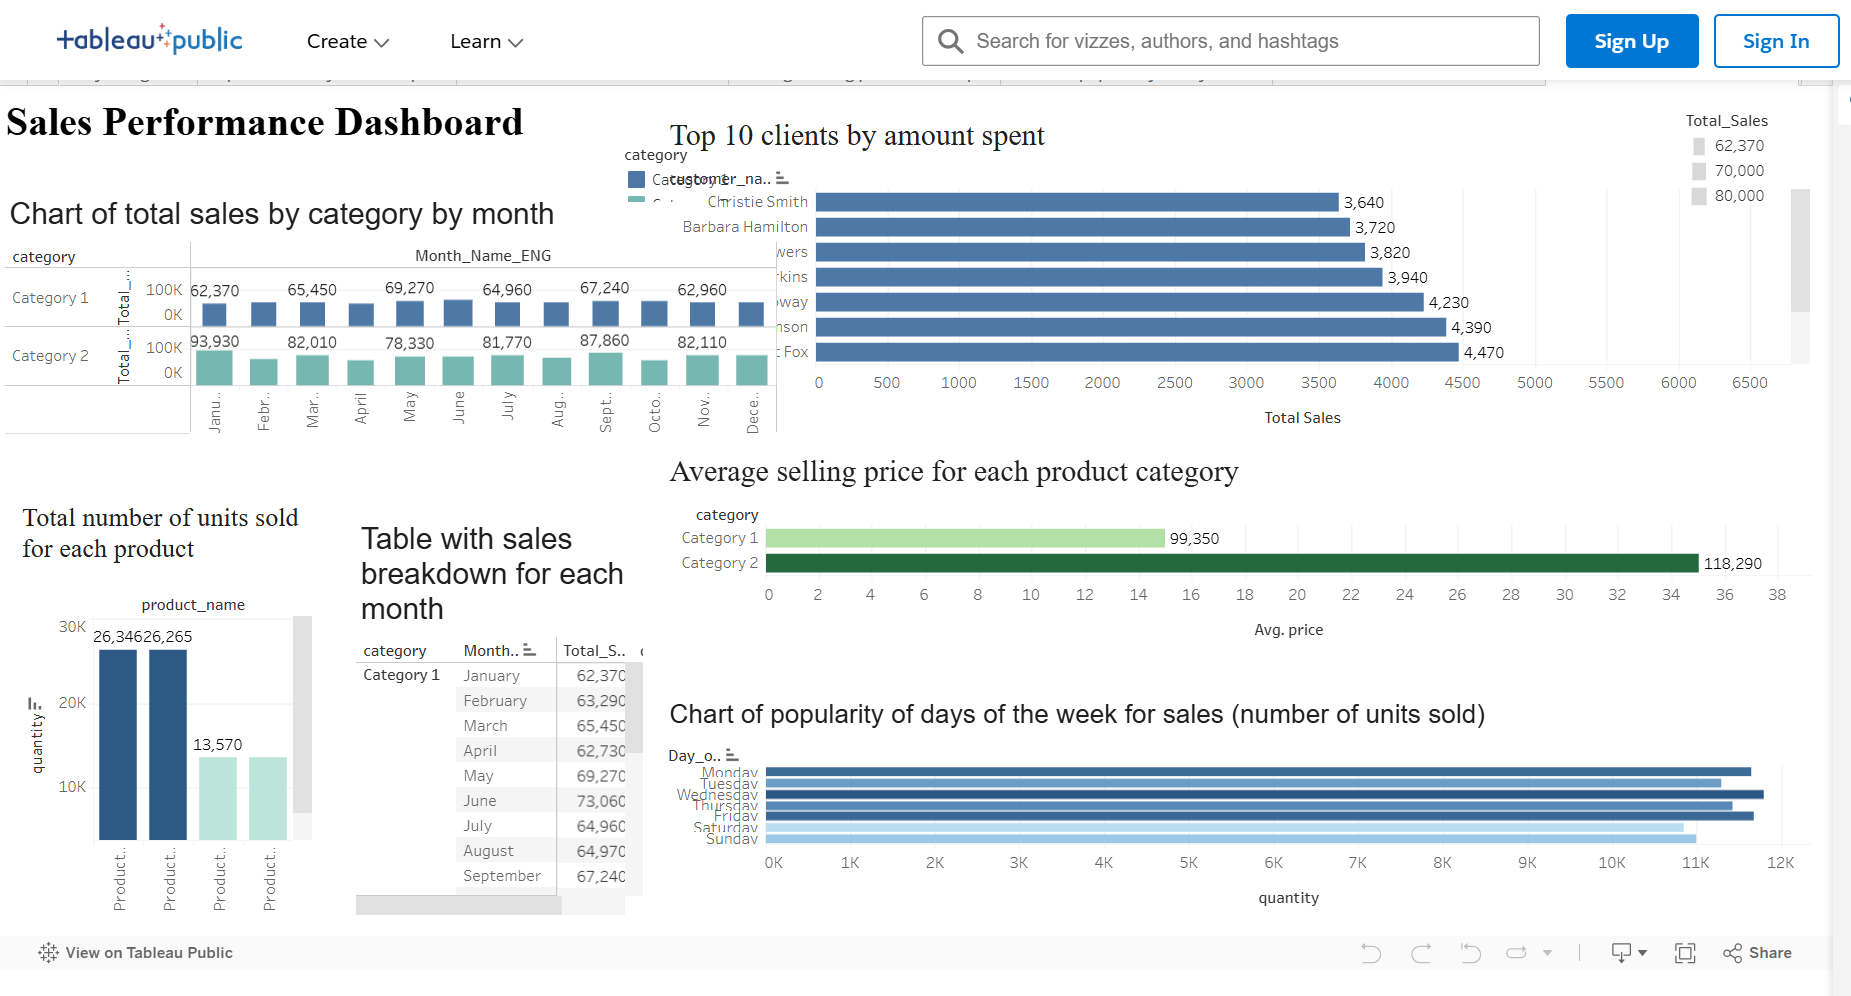
As part of a data analysis project, I built an interactive sales dashboard using Tableau to explore key trends in product sales and customer behavior. The dataset included order-level data with product, pricing, quantity, customer, and category information.
Main dashboard insights:
Monthly sales by category – time-series analysis to observe seasonality and category trends
Top 10 customers by revenue – horizontal bar chart highlighting top spenders
Quantity sold by product – helps identify best-selling items
Average price by product category – for pricing and margin analysis
Sales by day of the week – uncovers weekly patterns in demand
Detailed monthly sales table – with quantity, revenue, and categories for easy reference
Tools used:
Tableau Public
Calculated fields
Aggregations (SUM, AVG)
Filters and sorting
Custom date formatting
The dashboard combines six different visualizations in one interactive view to support decision-making for retail business analysis.
Sales Dashboard in Tableau As part of a data analysis project, I built an interactive sales dashboard using Tableau to explore key trends in product sales and customer behavior. The dataset included order-level data with product, pricing, quantity, customer, and category information. Main dashboard insights: Monthly sales by category – time-series analysis to observe seasonality and category trends. Top 10 customers by revenue – horizontal bar chart highlighting top spenders. Quantity sold by product – helps identify best-selling items. Average price by product category – for pricing and margin analysis Sales by day of the week – uncovers weekly patterns in demand Detailed monthly sales table – with quantity, revenue, and categories for easy reference.
Tools used: Tableau Public Calculated fields Aggregations (SUM, AVG) Filters and sorting Custom date formatting.
The dashboard combines six different visualizations in one interactive view to support decision-making for retail business analysis.
Навички: Data Analysis · Tableau · Analytical Skills · English · Business Intelligence (BI) · Intellectual
 Подольск