Designed and implemented an end-to-end ELT data pipeline and analytics dashboard in Snowflake to analyze the historical growth, market capitalization, and registration activity of the US banking sector using the FDIC Institutions dataset.
Key Responsibilities & Technical Highlights:
Data Architecture (ELT): Extracted raw, entity-level snapshot data from the Snowflake Marketplace into a Staging layer, performing all data transformations dynamically within the cloud data warehouse.
Data Modeling: Architected a highly performant Star Schema, parsing raw data into a central Fact table (FACT_BANK_PERFORMANCE) and associated Dimension tables (DIM_BANK_DETAILS, DIM_GEO, DIM_DATE).
Programmatic Dimension Generation: Engineered a continuous Calendar Dimension (1900–2050) using Snowflake generator functions (SEQ4(), ROW_NUMBER, DATEADD) to resolve time-series gaps and enable accurate historical JOINs using surrogate keys.
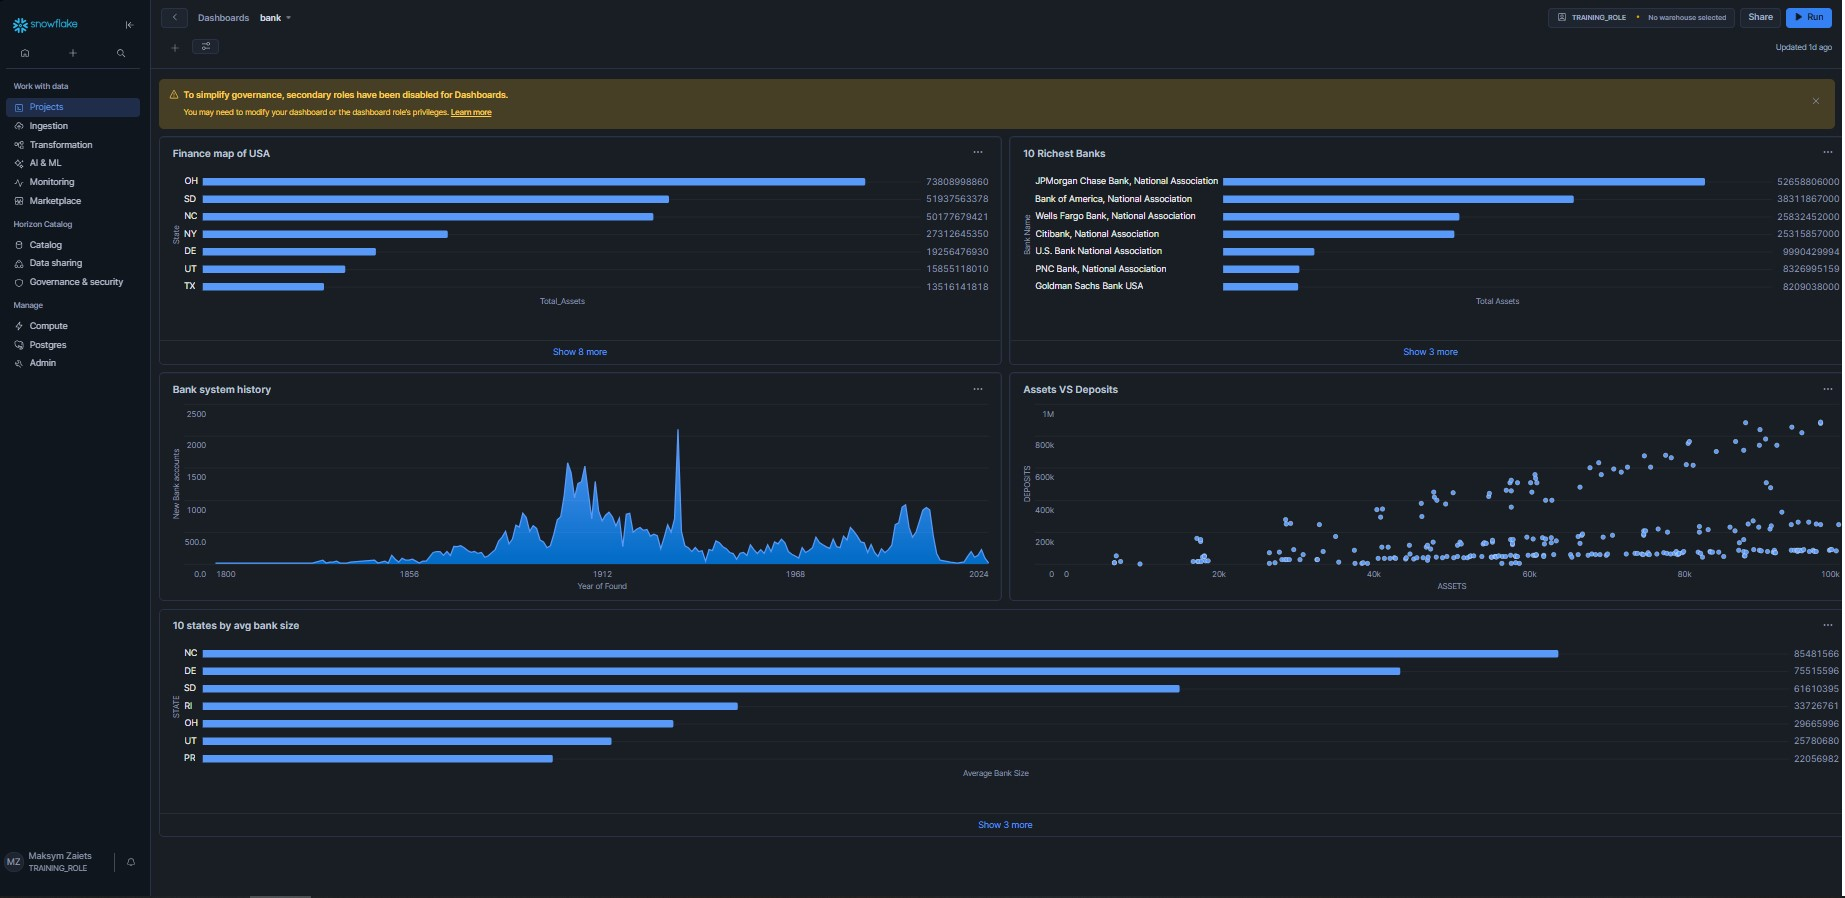
Data Visualization & Vintage Analysis: Developed interactive dashboards in Snowflake Snowsight. Built side-by-side analytical charts (Financial Volume vs. Bank Creating Activity) to illustrate macroeconomic trends, such as the impact of the 2008 financial crisis on new bank registrations and total asset accumulation.
Key Responsibilities & Technical Highlights:
Data Architecture (ELT): Extracted raw, entity-level snapshot data from the Snowflake Marketplace into a Staging layer, performing all data transformations dynamically within the cloud data warehouse.
Data Modeling: Architected a highly performant Star Schema, parsing raw data into a central Fact table (FACT_BANK_PERFORMANCE) and associated Dimension tables (DIM_BANK_DETAILS, DIM_GEO, DIM_DATE).
Programmatic Dimension Generation: Engineered a continuous Calendar Dimension (1900–2050) using Snowflake generator functions (SEQ4(), ROW_NUMBER, DATEADD) to resolve time-series gaps and enable accurate historical JOINs using surrogate keys.
Data Visualization & Vintage Analysis: Developed interactive dashboards in Snowflake Snowsight. Built side-by-side analytical charts (Financial Volume vs. Bank Creating Activity) to illustrate macroeconomic trends, such as the impact of the 2008 financial crisis on new bank registrations and total asset accumulation.