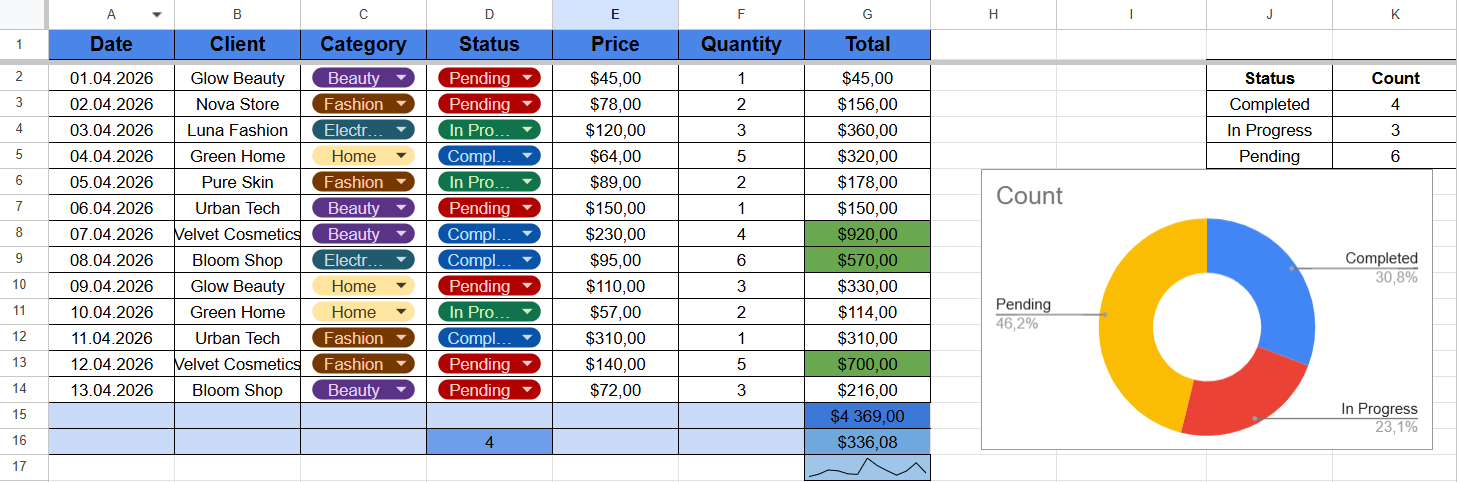
An analytical table has been created in Google Sheets using pivot tables for data processing and structuring. Key performance indicators have been calculated, information has been grouped, and basic visualization has been set up for convenient analysis.