Dashboard — Analytics of Auto Service
> ! The names of the sections in this description are fictional. The structure, logic, reports, and data volumes are original.
Description
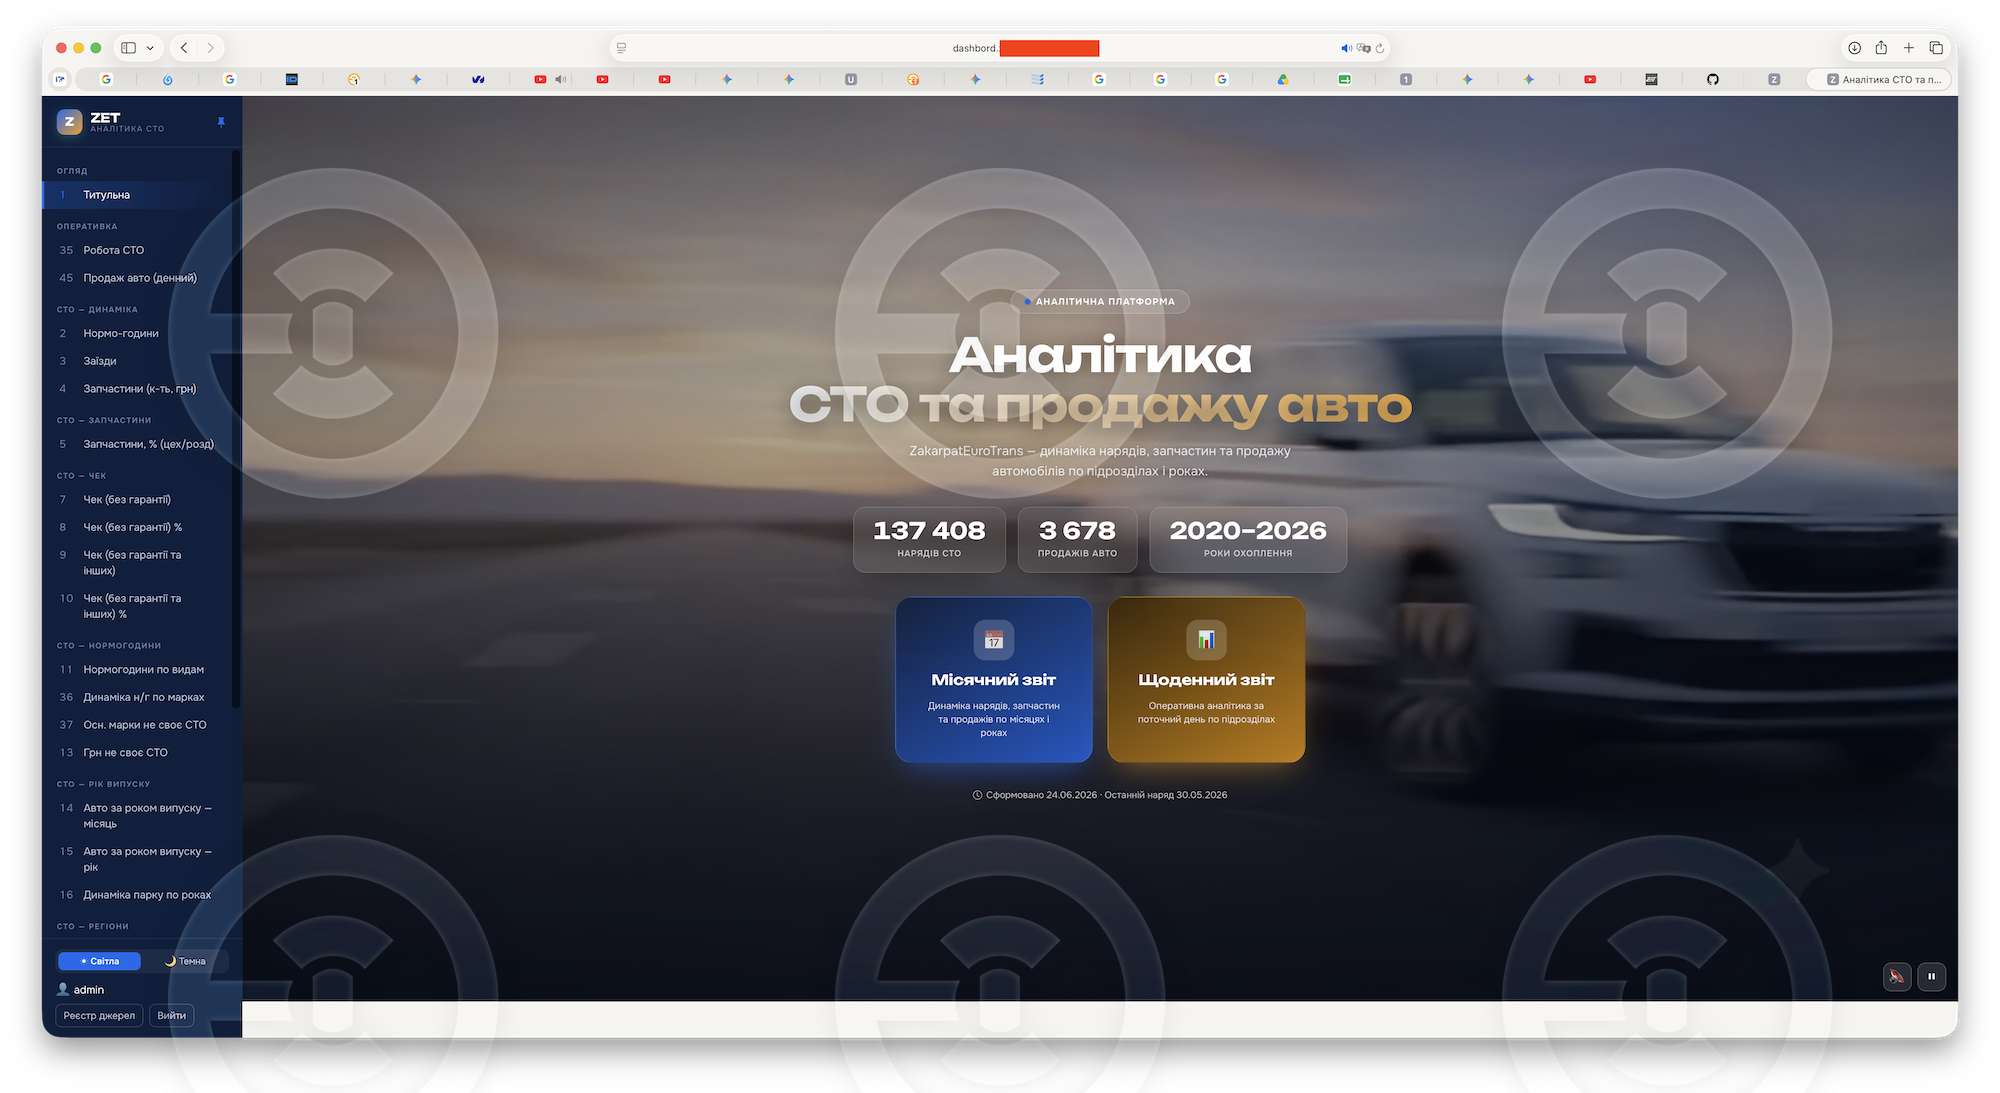
Analytical platform for a network of auto services: 27 reports with interactive charts, automatic ETL from Google Sheets, dynamic filters. Data is updated automatically on a schedule, charts are rendered on the client side using Chart.js.
Stack: Django 5.1+ / Python 3.13 / PostgreSQL 15 / Redis / Celery Beat / Docker / Bootstrap 5.3 / Chart.js
Data Volume
Table
Service Orders
Car Sales
Daily Statistics
Retail Parts
6 active sections, 69 car brands, 38 regions. 27 Google Sheets as data sources (~20,000 rows per order file). Average order cost: labor 6,500 UAH, parts 6,700 UAH.
27 implemented reports
- Operations: auto service work and car sales by day
- Dynamics: standard hours, entries, parts (quantity/UAH)
- Check: without warranty, without other services (washing, tire fitting, glass, etc.), % options
- Standard hours: by types of work, by brands, third-party auto services
- Year of manufacture: by months/years, fleet dynamics
- Regions: regional structure of clients
- Additional: revenue, warranty vs commerce, top brands, department ratings
Key Features
- Automatic ETL: Celery Beat synchronizes Google Sheets → PostgreSQL, deduplication by SHA-256 hash of the row
- Dynamic filters: multi-select for sections, year, region, brand, year of manufacture, currency (UAH/$) — without reloading
- 27 charts: bar, stacked-bar, line, stacked-bar-100, pivot tables
- KPI cards: average check, dynamics compared to the previous year
- Order audit: modal window with a schedule of reasons for exclusion from the denominator
- Collapsed mode: collapsing small sections into "Total"
- Admin panel: django-unfold. Security: login_required, RBAC
Architecture
apps/
├── core/ — models, roles, migrations
├── dashboard/ — 27 reports, API, filters
│ └── services/ — 13 aggregation modules
├── ingest/ — ETL: Google Sheets → DB (4 types of sources)
└── rates/ — currency rates
Challenges
1. Normalization of directories: data from 1C contains various spellings of names — a system of canonical aliases has been built
2. Deduplication: append-only sheets without a natural key → upsert by hash
3. Business logic of reports: multi-level exclusions (warranty → PPP → "other services"), AND logic of core work
4. Double sheet: 2 sheets of the file (main + retail parts) are processed separately
5. Performance: SQL indexes, annotated queries, select_related
Infrastructure
Docker Compose: PostgreSQL, Redis, Django (Gunicorn), Celery Worker + Beat, Nginx. Deployment: docker compose up -d. Production via Apache reverse-proxy, Whitenoise for static files.
> ! The names of the sections in this description are fictional. The structure, logic, reports, and data volumes are original.
Description
Analytical platform for a network of auto services: 27 reports with interactive charts, automatic ETL from Google Sheets, dynamic filters. Data is updated automatically on a schedule, charts are rendered on the client side using Chart.js.
Stack: Django 5.1+ / Python 3.13 / PostgreSQL 15 / Redis / Celery Beat / Docker / Bootstrap 5.3 / Chart.js
Data Volume
Table
Service Orders
Car Sales
Daily Statistics
Retail Parts
6 active sections, 69 car brands, 38 regions. 27 Google Sheets as data sources (~20,000 rows per order file). Average order cost: labor 6,500 UAH, parts 6,700 UAH.
27 implemented reports
- Operations: auto service work and car sales by day
- Dynamics: standard hours, entries, parts (quantity/UAH)
- Check: without warranty, without other services (washing, tire fitting, glass, etc.), % options
- Standard hours: by types of work, by brands, third-party auto services
- Year of manufacture: by months/years, fleet dynamics
- Regions: regional structure of clients
- Additional: revenue, warranty vs commerce, top brands, department ratings
Key Features
- Automatic ETL: Celery Beat synchronizes Google Sheets → PostgreSQL, deduplication by SHA-256 hash of the row
- Dynamic filters: multi-select for sections, year, region, brand, year of manufacture, currency (UAH/$) — without reloading
- 27 charts: bar, stacked-bar, line, stacked-bar-100, pivot tables
- KPI cards: average check, dynamics compared to the previous year
- Order audit: modal window with a schedule of reasons for exclusion from the denominator
- Collapsed mode: collapsing small sections into "Total"
- Admin panel: django-unfold. Security: login_required, RBAC
Architecture
apps/
├── core/ — models, roles, migrations
├── dashboard/ — 27 reports, API, filters
│ └── services/ — 13 aggregation modules
├── ingest/ — ETL: Google Sheets → DB (4 types of sources)
└── rates/ — currency rates
Challenges
1. Normalization of directories: data from 1C contains various spellings of names — a system of canonical aliases has been built
2. Deduplication: append-only sheets without a natural key → upsert by hash
3. Business logic of reports: multi-level exclusions (warranty → PPP → "other services"), AND logic of core work
4. Double sheet: 2 sheets of the file (main + retail parts) are processed separately
5. Performance: SQL indexes, annotated queries, select_related
Infrastructure
Docker Compose: PostgreSQL, Redis, Django (Gunicorn), Celery Worker + Beat, Nginx. Deployment: docker compose up -d. Production via Apache reverse-proxy, Whitenoise for static files.