Dashboard for calculating Revenue Metrics
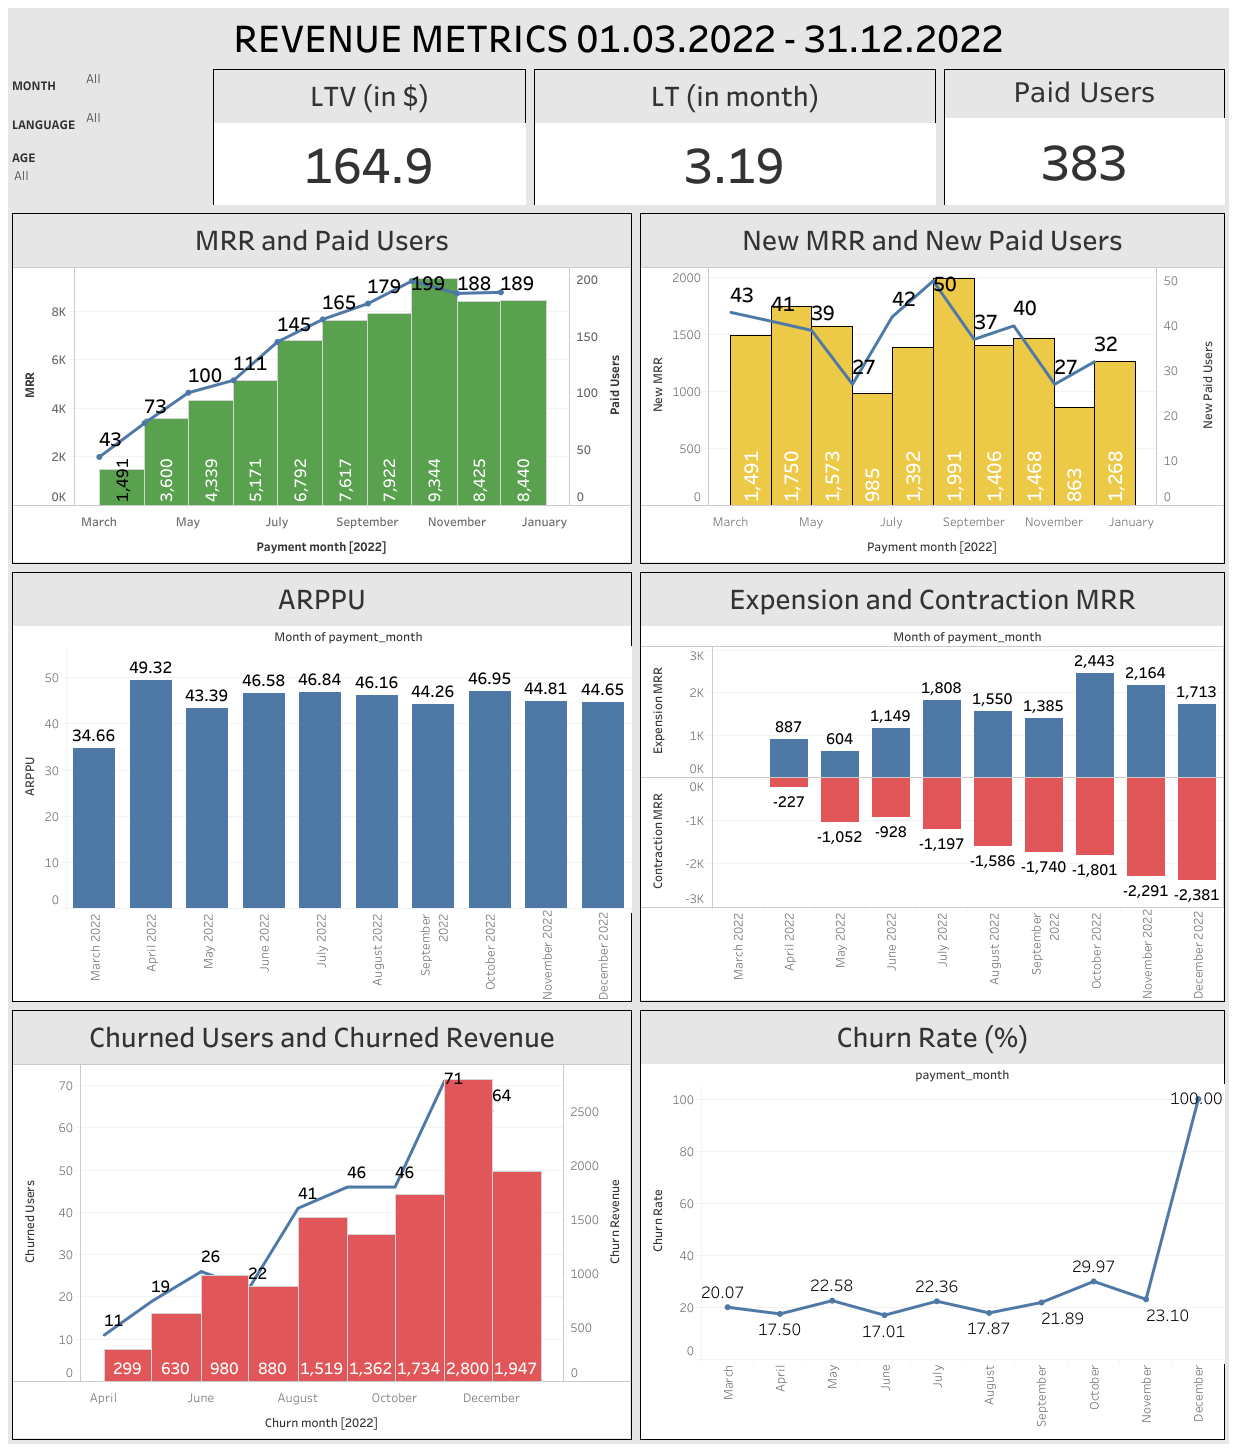
The work on the order consisted of several stages, writing SQL code, which calculated some metrics, as well as creating a table with data for further analysis. The next stage was calculating metrics, building graphs that reflect the results of the analysis, and creating an interactive dashboard in Tableau. The goal of the work is to help the client optimize the company's operations, track the dynamics of cash inflows, analyze the results, and develop a plan to improve the company's performance.
 Neteshin