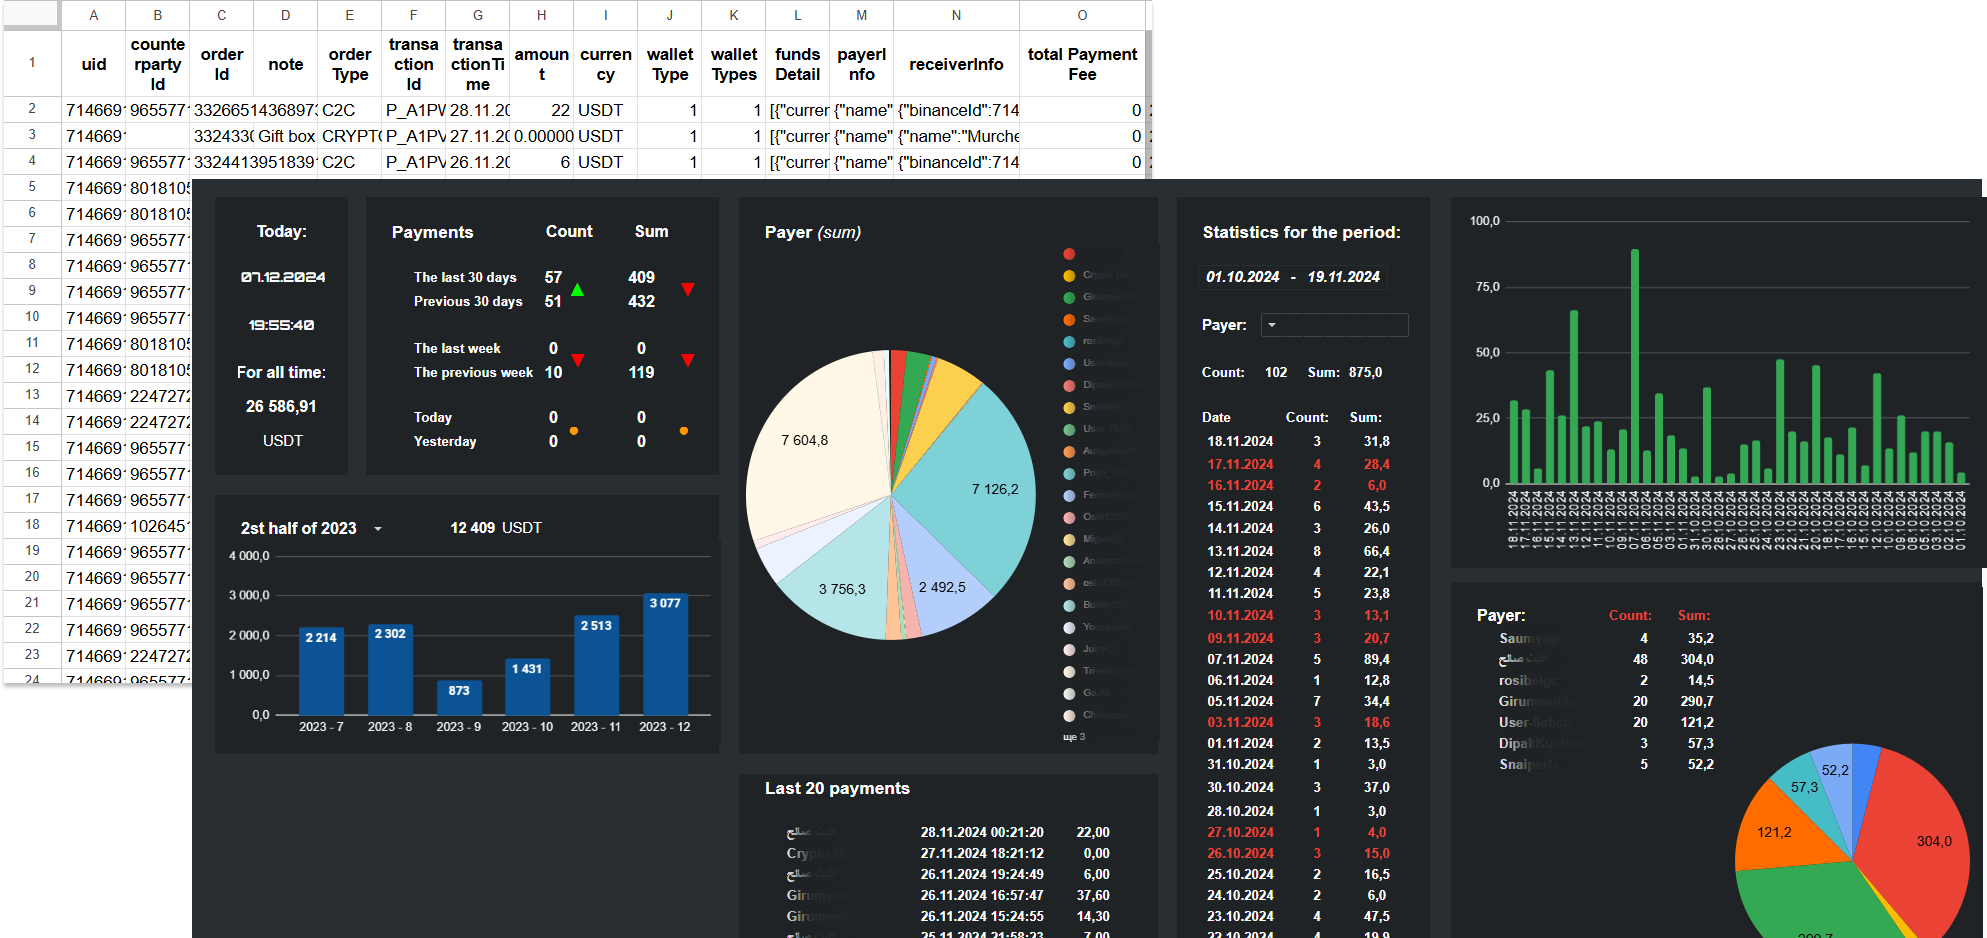
Key features of the dashboard:
Dashboard:
Technical specifications:
Data is automatically loaded from a tab in this file or can be pulled from external Google Sheets.
Real-time updates are provided through formulas and Google Apps Script.
Flexible adaptation to user needs through interactive filters.
Data for today: current date, update time, total transaction amount (in USDT).
Activity analysis: number and amount of transactions for the last 30 days, week, today, and yesterday.
Graphical visualization:
Histogram broken down by months, showing transaction dynamics over half a year of different years.
Pie charts: analysis of transaction amounts by payers and their share of the total volume.
Detailed data:
Table of the last 20 transactions indicating date, payer, quantity, and amount.
Statistics for the selected period: number of transactions, amounts, and list of payers.
Additional analysis:
List of payers with total number and volume of transactions.
Line chart to display daily transaction activity.
Design features:
Clear zoning of information for ease of analysis.
Contrasting design for quick perception of key indicators.
Interactive elements for data detailing.
This dashboard is an effective tool for monitoring and analyzing financial data, allowing for important insights in a convenient format.
Dashboard:
Technical specifications:
Data is automatically loaded from a tab in this file or can be pulled from external Google Sheets.
Real-time updates are provided through formulas and Google Apps Script.
Flexible adaptation to user needs through interactive filters.
Data for today: current date, update time, total transaction amount (in USDT).
Activity analysis: number and amount of transactions for the last 30 days, week, today, and yesterday.
Graphical visualization:
Histogram broken down by months, showing transaction dynamics over half a year of different years.
Pie charts: analysis of transaction amounts by payers and their share of the total volume.
Detailed data:
Table of the last 20 transactions indicating date, payer, quantity, and amount.
Statistics for the selected period: number of transactions, amounts, and list of payers.
Additional analysis:
List of payers with total number and volume of transactions.
Line chart to display daily transaction activity.
Design features:
Clear zoning of information for ease of analysis.
Contrasting design for quick perception of key indicators.
Interactive elements for data detailing.
This dashboard is an effective tool for monitoring and analyzing financial data, allowing for important insights in a convenient format.