The report is designed for the major distributor of aesthetic medicine. Partly, the company has already worked on the business analytics system Power BI, so a comprehensive implementation was not required. They made a dashboard for the sales department so that ROP'am (the sales department manager) was easier to follow the indicators of managers.
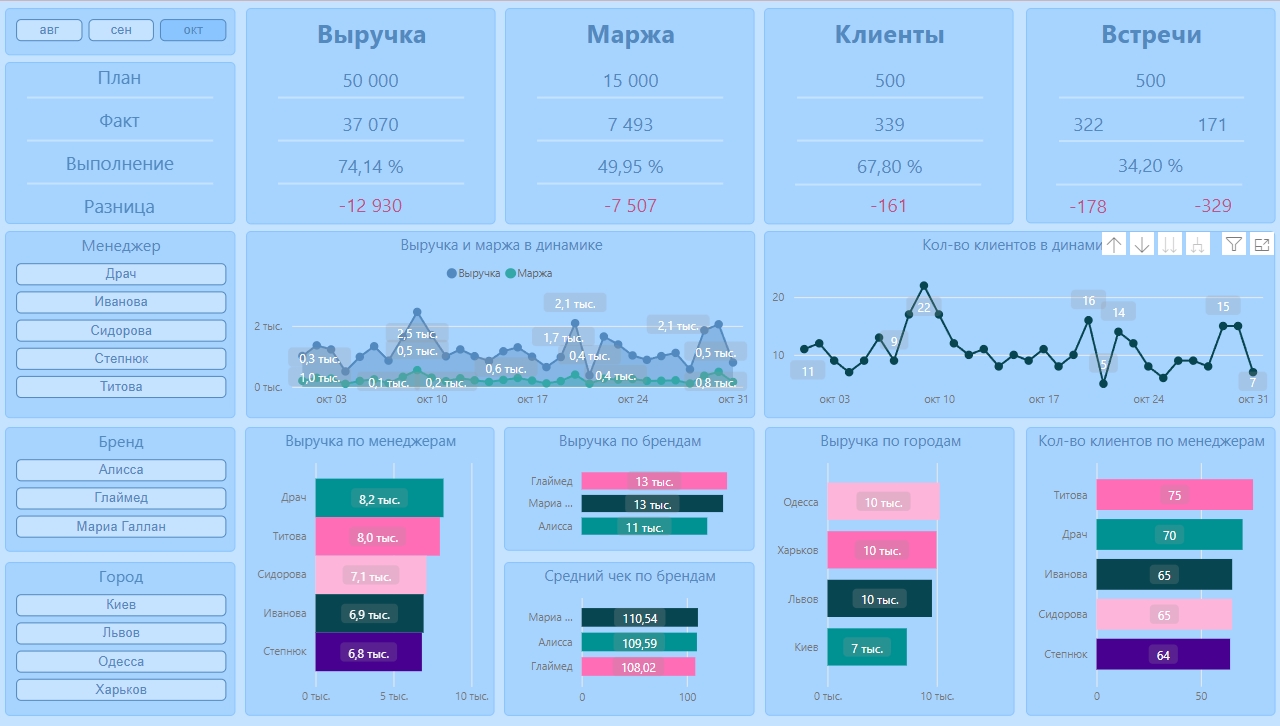
In the dashboard is presented a plan/fact of indicators - revenue, margins, customer base, meetings with customers. It is possible to filter data on managers, brands and cities. In addition, the revenue, margin and call-to customers on visualization are presented in dynamics by day.
In the dashboard is presented a plan/fact of indicators - revenue, margins, customer base, meetings with customers. It is possible to filter data on managers, brands and cities. In addition, the revenue, margin and call-to customers on visualization are presented in dynamics by day.