Power BI Dashboard
Data Processing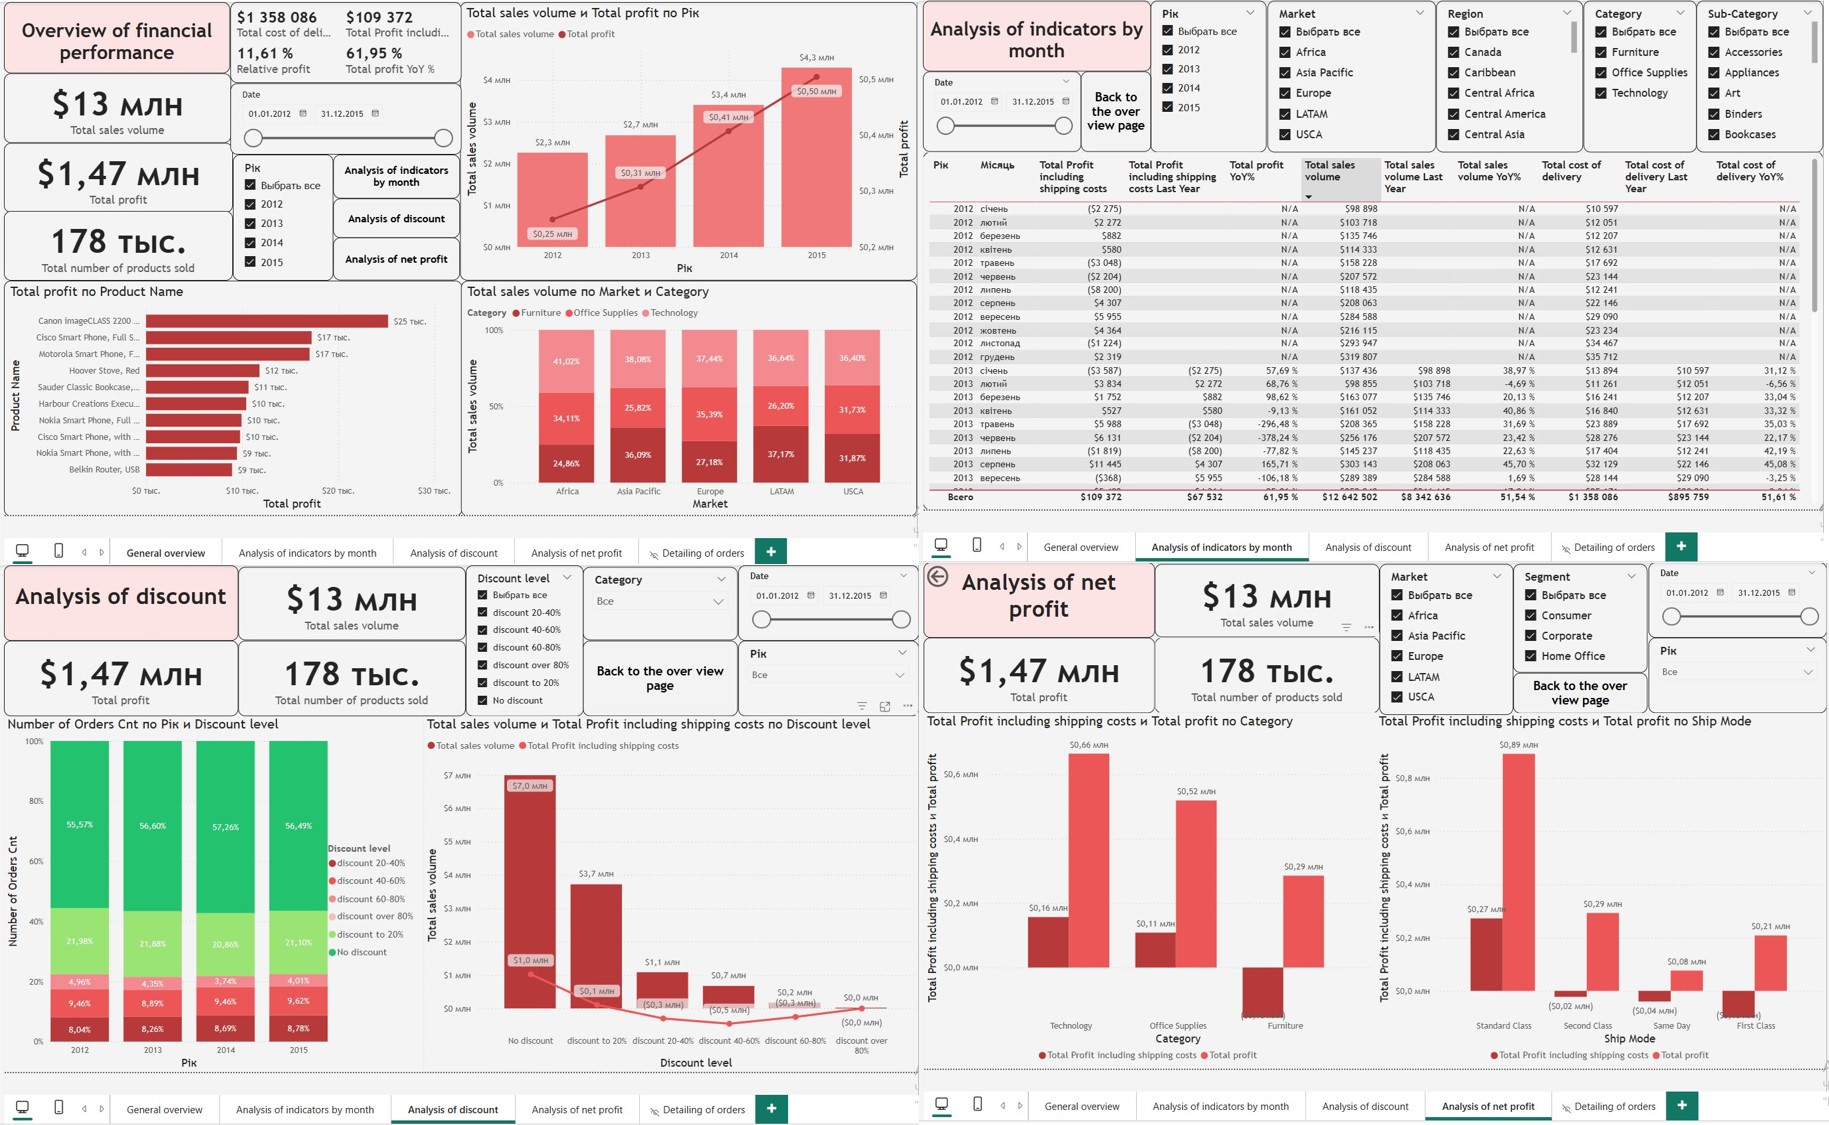
Development of a standard Power BI Dashboard for tracking store activity over a specific period. Data imported from several Excel tables, relationships built between tables, a separate table created for measure calculations.
The dashboard consists of 4 sheets: 1) Overview page of financial indicators; 2) Page for exploring indicators by month; 3) Page with discount analysis; 4) Page with profit analysis.
Main types of DAX formulas used for calculations:
SUM, MAX, MIN, COUNT, CALCULATE, DATEADD, DIVIDE.
#PowerBI #DashBoards #DAX #dashboard
The dashboard consists of 4 sheets: 1) Overview page of financial indicators; 2) Page for exploring indicators by month; 3) Page with discount analysis; 4) Page with profit analysis.
Main types of DAX formulas used for calculations:
SUM, MAX, MIN, COUNT, CALCULATE, DATEADD, DIVIDE.
#PowerBI #DashBoards #DAX #dashboard