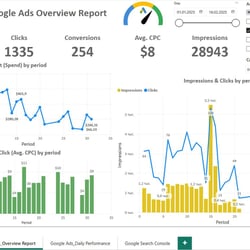
Switch to English?
Yes
Переключитись на українську?
Так
Переключиться на русскую?
Да
Przełączyć się na polską?
Tak

Denis Shlyahov

Offer Denis work on your next project.

Ukraine Kharkiv, Ukraine
4 days 13 hours back
A little busy a little busy
1 Safe completed
1 year back
1 client
age 33 years
on the service 1 year
  • Microsoft SQL Server
  • Google Apps Script
  • microsoft excel
  • Excel VBA
  • PowerQuery
  • Postgre SQL
  • api google sheets
  • MS Power Query
  • Power BI
  • Google Sheets
  • SQL

Rating

Successful projects
No data
Average rating
No data
Rating
516
Data Processing
64 place out of 1487

Language proficiency level

Українська Українська: fluent
Русский Русский: fluent
English English: pre-intermediate

Skills and abilities

Services

Outsourcing & consulting

Portfolio


  • Decomposition Tree

    Data Processing
    Decomposition Tree is a visualization that allows analyzing data by breaking it down into different categories. It helps to understand which factors influence a certain metric by automatically or manually adding levels of detail.
    #PowerBI #DashBoards
  • Typical Sales Dashboard in Google Sheets

    Data Processing
    Development of a standard Dashboard in Google Sheets for tracking sales dynamics. Built graphs and charts, created dynamic cards with sales/profit summaries, number of transactions, configured slicers by region, product line, brands, etc.
    #GoogleSheets #report #DashBoards
  • Power BI Dashboard (tracking Google Search Console)

    Data Processing
    Development of a Power BI Dashboard for an overall overview of metrics from Google Search Console (Clicks, Avg. Position, Avg. CTR, Impressions). Customized import from Google Ads via API connector in Google Sheets (client's request), import from Google Sheets to Power BI, relationships between tables established, a separate table created for metric calculations, filtering by accounts and dates implemented.
    #PowerBI #DashBoards #dashboard #GoogleSheets #GoogleAds #api-development
  • Power BI Dashboard (tracking metrics from Google Ads)

    Data Processing
    Development of a Power BI Dashboard for an overall overview of metrics from Google Ads (Cost, Clicks, Conversions, Avg.CPC, Impressions). Customized import from Google Ads via API connector to Google Sheets (client's request), import from Google Sheets to Power BI, relationships between tables established, a separate table created for metric calculations.
    #PowerBI #DashBoards #dashboard #GoogleSheets #GoogleAds #api-development
  • Power BI Dashboard Sales Report

    Data Processing
    Development of a standard Power BI Dashboard for tracking sales over a specific period. Data imported from several Excel tables, relationships built between tables, a separate table created for measure calculations.
    Main types of DAX formulas used for calculations:
    SUM, MAX, MIN, COUNT, CALCULATE, DATEADD, DIVIDE, DISTINCTCOUNT, AVG, FILTER, AVERAGEX, SAMEPERIODLASTYEAR, TOTALYTD.
    #PowerBI #DashBoards #DAX #dashboard
  • Power BI Dashboard

    Data Processing
    Development of a standard Power BI Dashboard for tracking store activity over a specific period. Data imported from several Excel tables, relationships built between tables, a separate table created for measure calculations.
    The dashboard consists of 4 sheets: 1) Overview page of financial indicators; 2) Page for exploring indicators by month; 3) Page with discount analysis; 4) Page with profit analysis.
    Main types of DAX formulas used for calculations:
    SUM, MAX, MIN, COUNT, CALCULATE, DATEADD, DIVIDE.
    #PowerBI #DashBoards #DAX #dashboard
  • Typical Power BI Dashboard

    Data Processing
    Development of a standard Power BI Dashboard for tracking supermarket activity over a specific period. Built graphs and charts, created dynamic cards with sales summaries, configured filters by currency, months, quarters, product categories, etc.
    #PowerBI #report #DashBoards #dashboard #chart
  • Development of a template in Google Sheets for calculating economics

    Data Processing
    Development of a template for calculating economics for a business. Data is automatically collected from several separate Google Sheets (Timesheet, Materials Used, Accounting, etc.) and in the main file, the cost and profit for each completed order are calculated. The main types of formulas used for data collection and calculations: IMPORTRANGE, VLOOKUP, ARRAYFORMULA, COUNTA, SUMIFS, CONCATENATE, FILTER, IF, UNIQUE, FLATTEN, CHOOSE, VALUE, SUBSTITUTE.
    #report #GoogleSheets
  • Typical Excel Dashboard

    Data Processing
    Development of a standard Excel Dashboard for tracking the activities of an online clothing store. Built graphs and charts, created dynamic cards with sales/profit summaries, configured filters by months, quarters, product categories, etc.
    #Excel #report #DashBoards
  • Development of a report for tracking marketing metrics

    Data Processing
    Development of an annual report for tracking marketing metrics by platforms and months. Main types of formulas used for data collection and calculations: IMPORTRANGE, VLOOKUP, ARRAYFORMULA, COUNTA, SUMIFS, CONCATENATE, FILTER, IF.
    #GoogleSheets #report

Reviews and compliments on completed projects 1

Quality
Professionalism
Cost
Contactability
Deadlines

I am satisfied with the work. It was clearly done according to the specifications and on time. We also agreed to "fine-tune" the file in the future - some technical nuances have currently arisen that I did not foresee in the initial specifications. I recommend the performer!

Activity

  Latest proposals 10
Excel spreadsheet for the human resources department
225 USD
I am looking for an expert in Google Sheets for a second small project. Personal project
I am looking for an expert in Google Sheets for a second small project.
23 USD
Data processing and filling out tables
34 USD
Google Sheets and DASHBOARD Setup - Business ANALYTICS
45 USD
Editing the database in Excel
23 USD
Excel - merge into one column
29 USD
Copy the Google Sheets table with formulas (which does not belong to me)
113 USD
Create a table for accounting of the store with technology (smartphones, laptops)
90 USD
Excel, Google Sheets
23 USD