Data Visualization
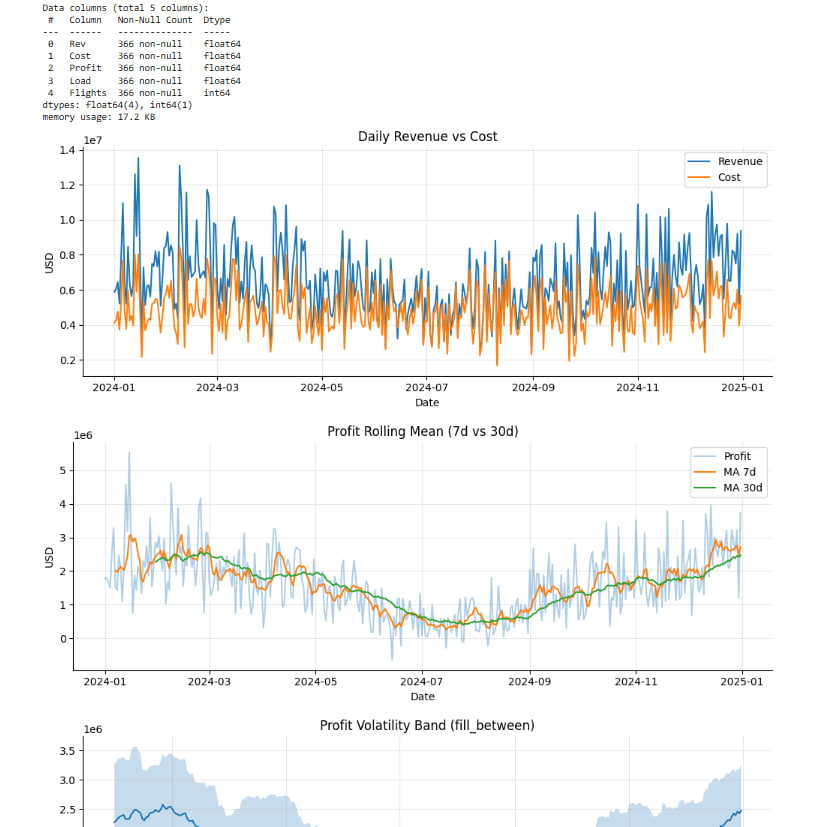
This project presents an analysis of time series of airline route profitability using Python, Pandas, and Matplotlib. It was created as a homework assignment aimed at creating clear and well-structured visualizations in the OOP style of Matplotlib. The analysis is based on flight data and explores how revenue, expenses, profit, load factor, and flight frequency change over time.
 Kyiv
Kyiv