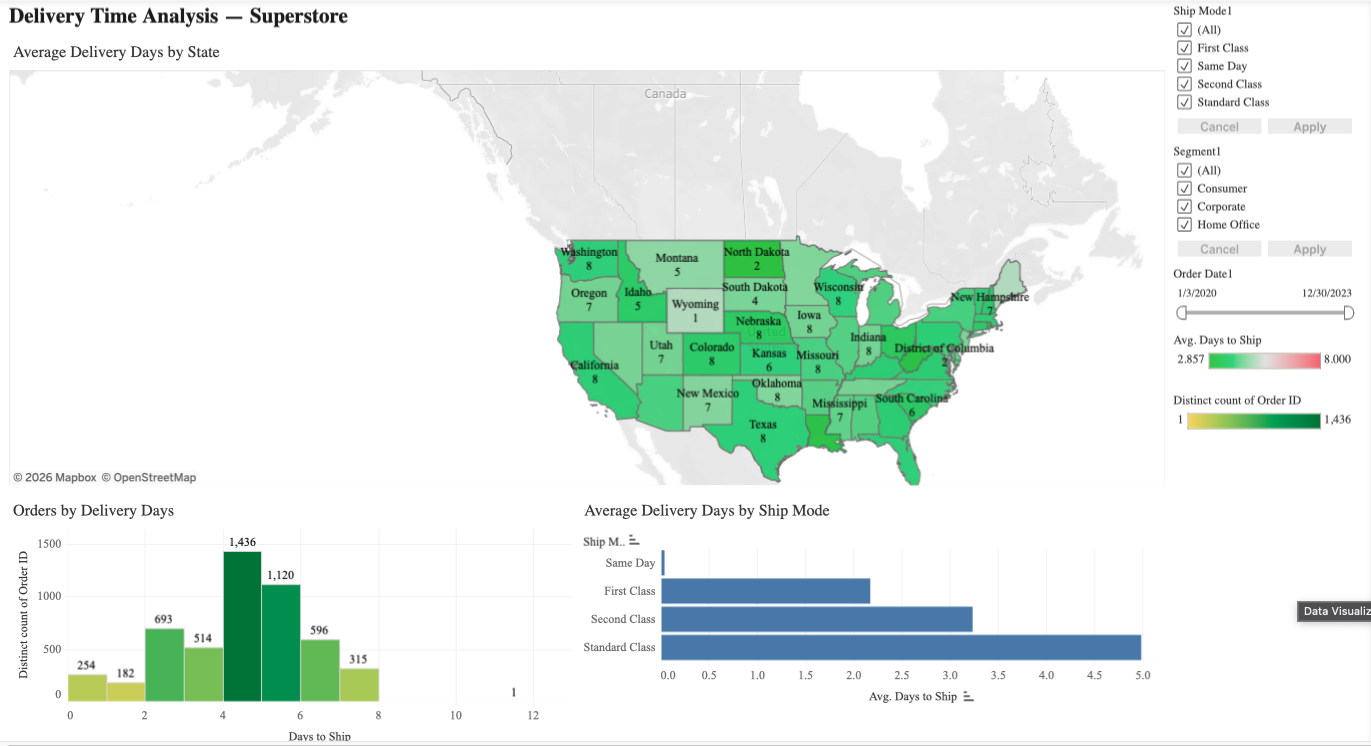
Analyzed the delivery efficiency across the states of the USA using the Superstore dataset to identify patterns in delivery time and operational efficiency. Calculated the delivery duration — from the moment of order to shipment — and visualized:
• Average number of delivery days by delivery types (e.g., First Class, Standard Class)
• Distribution of orders by number of delivery days
• Average delivery time by states on a geographical map with gradient visualization
Key insights:
• Standard Class delivery takes the most time (on average 4–5 days), while Same Day is completed within 1 day
• Central states of the USA demonstrate a somewhat faster average delivery time
Result:
Created an interactive dashboard in Tableau with filters by order date, segment, and delivery type, allowing for flexible analysis of delivery efficiency and identification of bottlenecks.