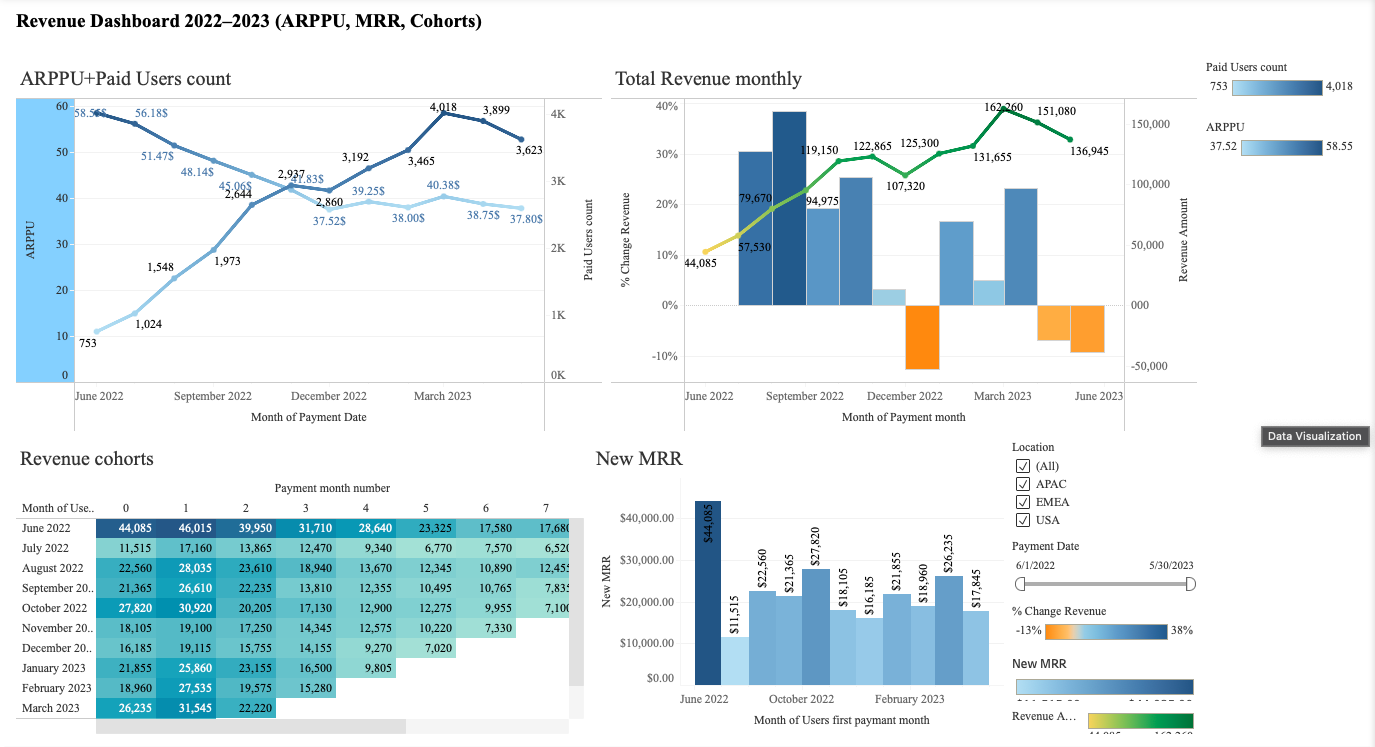
Developed an interactive dashboard in Tableau for analyzing revenue dynamics, ARPPU trends, and user cohorts. Integrated payment data, calculated monthly recurring revenue (MRR), user retention, and percentage growth. Visualized key business metrics to identify revenue fluctuations and improve decision-making.
Key results:
• Built visualizations of ARPPU and MRR to track revenue growth month by month
• Created cohort analysis to assess user retention and recurring revenue
• Increased reporting speed and data transparency for business analysis.
Key results:
• Built visualizations of ARPPU and MRR to track revenue growth month by month
• Created cohort analysis to assess user retention and recurring revenue
• Increased reporting speed and data transparency for business analysis.